Heads or Tails? How Probability Theory Is Used in IT
And why is it important for programmers and data analysts to study it?
Probability theory is an important tool that helps generate random numbers for simulations and cryptography, improve algorithms and data structures, and develop accurate models for machine learning.
Together with the 365 education team and a data science specialist in Big Data, we explore the basic concepts of probability theory and explain where and how it’s used.
What is probability theory?
Probability theory is a branch of mathematics that studies random events and looks for patterns in them.
It uses mathematical models to describe random processes, such as lottery draws or weather changes. It allows specialists to analyze and predict outcomes under uncertainty.
Let’s look at the basic concepts of probability theory.
Probability
This is a numerical measure that indicates the probability of a specific event occurring. It is expressed as a number between 0 and 1, where 0 means the event is impossible and 1 means the event will definitely occur.
For example, when tossing a coin, the probability of getting either side is 0.5, or 50%.
Random event
This is a possible outcome of a random experiment, which may or may not occur. Such an experiment is an event or action whose outcome cannot be precisely predicted due to the influence of random factors.
For example, meteorologists determine the probability of precipitation by analyzing statistical data.

Probability distributions
They show the probability with which different outcomes of a random event can occur.
There are various mathematical models, or distribution types, that describe this probability. The choice of a specific type depends on the data being analyzed or the situation being modeled. They are divided into two groups: discrete and continuous.
Discrete distributions
They are used to describe events with a specific number of possible outcomes. That is, when the outcome of an event can be listed point by point.
Example: A roll of a die can yield one of six possible outcomes, from 1 to 6. Each outcome can be clearly defined and counted.
Examples of discrete distributions:
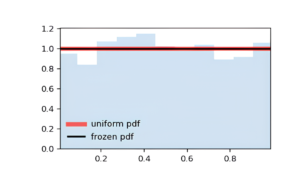
The uniform distribution is one of the simplest distributions, in which all outcomes have the same probability.
For example, when tossing a coin, the probability of getting heads or tails is 0.5.
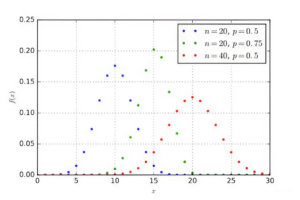
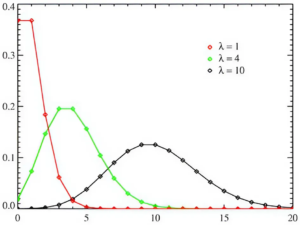
Poisson distribution – used to determine the probability of how many times a certain event will occur in a fixed period of time or in a given space.
This distribution is used when events occur independently of each other and with a constant average frequency.
Example: how many calls a call center receives per hour.
Geometric distribution describes how many attempts it takes to achieve the first success. The probability of success should be equal.
For example, how many times do you have to toss a coin before it comes up heads?
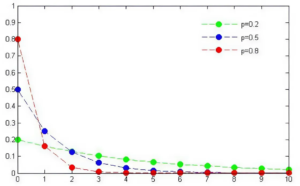
Continuous distributions
They are used to describe events that can have an infinite number of outcomes. In a continuous distribution, it is impossible to precisely list all possible outcomes because they are not limited to specific values but can be any number within a given interval.
These distributions are used to analyze data and model situations where outcomes are measured by continuous quantities such as weight, height, time, temperature, etc.
Examples of continuous distributions:
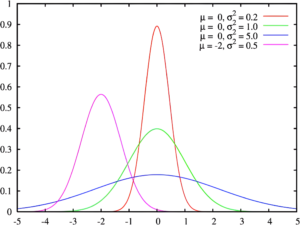
Normal (Gaussian) distribution— data is distributed in a bell-shaped pattern, with most values clustered around the mean.
For example, if you take people’s height, then most will be around average, and there will be few very tall or very short people.
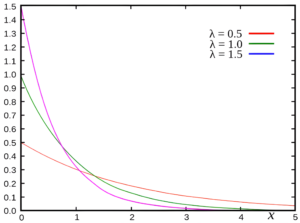
The exponential distribution is a form of the Gaussian distribution in which the data describe the time between events that occur at a constant average interval.
For example, the average travel time for a bus from one point to another.
Random variable
A variable that takes on a single value depending on the outcome of a random experiment. It can be discrete or continuous:
- Discrete – takes on a finite or infinite number of distinct values. For example, the number of students in a course is always an integer.
- Continuous— can take on any value within a certain range. For example, the area of a plot of land, which can also be measured with any degree of precision: kilometers are made up of meters, meters of centimeters, and so on.
To represent the result of a random variable, random numbers are needed. The process of creating them is called generation.
Random number generation is divided into two main types:
- Truly random numbers are created using specialized devices that exploit unpredictable physical processes, such as atmospheric noise, radioactive decay, and so on. For example, the RDRAND instruction in Intel processors generates numbers using thermal noise in electronic components.
- Pseudorandom numbers are generated by algorithms and appear random, but can be reproduced if the initial value, or “seed,” is known. An example is the linear congruential generator, which is widely used in modeling and statistics but is unsuitable for cryptography due to its predictability.
What programming languages are used to work with probability theory?
Python
Python is one of the most popular languages for working with probability theory. It’s easy to use and contains numerous libraries and frameworks that make it easy to work with probabilistic and statistical models.
Main libraries:
- NumPy – basic mathematical and statistical functions;
- SciPy – advanced mathematical and statistical functions;
- Pandas – working with tabular data and time series;
- Matplotlib and Seaborn – data visualization;
- Statsmodels – statistical modeling;
- Scikit-learn — machine learning and modeling.
R
R is specifically designed for statistical analysis and data visualization.
Main libraries:
- dplyr and data. table — working with data;
- ggplot2 — data visualization;
- caret — machine learning.
MATLAB
MATLAB is used in engineering and scientific research for mathematical calculations. It contains various functions for probability calculations, statistical analysis, and machine learning. It is a commercial platform that requires an expensive license, so beginning programmers may want to consider more affordable options.
The main tool is the Statistics and Machine Learning Toolbox library for statistical analysis and machine learning.
Where is probability theory applied?
Cryptography
Probability theory helps protect data from hacking. Here are some ways it’s used:
- Key generation. Random number generation allows you to create unique and secure keys for message encryption.
- Randomness check. Probabilistic tests are used to verify the security of keys. If a key passes them, it means it is difficult to predict.
- Key exchange protocols. When transmitting keys over the internet, methods are used to protect the keys even if attackers intercept them.
Encryption and decryption. Using probability theory, algorithms are created that alter data so that it cannot be read without the correct key.
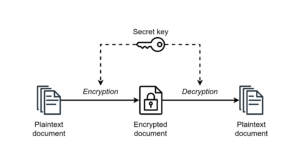
Encryption and decryption. Source
Machine learning
Probability theory is used in reinforcement machine learning to find the best courses of action in environments where outcomes are unpredictable.
An example is the CoinRun training environment. In it, a model tests different strategies to learn how to achieve goals, such as collecting coins.

Probabilistic models can also predict the results of certain actions based on input data, evaluate an object’s membership in a given class, and recognize speech.
How it works: For example, speech recognition systems model a sequence of sounds as a series of states with probabilistic transitions between them. This is how the system learns to predict the next sound based on the previous ones.
Data Analysis and Data Science
Social media user data analysis. Probability theory helps study online behavior to understand how people interact with each other and what content will interest them.
For example, a random walk model can be used to understand how information moves from one user to another.

Time series forecasting in business analytics. These are data analysis methods that predict future prices or values of instruments such as stocks, bonds, or currencies based on their past performance. Examples include the ARIMA model and the Monte Carlo method.
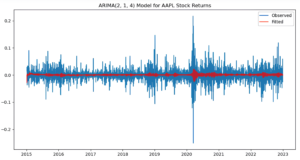
Analyzing customer activity in online retail. Tracking customer actions on a website helps improve the user experience and increase sales. For example, a logistic regression model estimates the likelihood that a customer will purchase a particular product.
Many games use random numbers to create unpredictable events, such as enemy spawns, item drops, or random gameplay scenarios. A pseudo-random number generator (PRNG) is used for this purpose.
Such events can be random even before the player makes a decision, such as the placement of objects in sandbox games. Other random events occur after the player has made a choice, such as the chance to hit an enemy or dodge an attack.

How to study probability theory
A thorough understanding of probability theory can be obtained at universities. Complex topics, such as random processes and modeling, are typically studied in engineering and economics departments. During their studies, students not only learn the fundamentals of theory but also learn how to work with data, which is essential for working in artificial intelligence.
Studying at university also offers the opportunity to participate in research projects. This helps you better understand the subject and gain experience for a future career in science and technology.
Useful materials on the topic:
- Probability and Statistics, Khan Academy is a free course from Khan Academy with interactive videos and quizzes. It consists of 16 modules and covers topics such as conditional probability, combinatorics, probability distributions, and descriptive statistics.
- Introduction to Probability, by Dimitri P. Bertsekas and John N. Tsitsiklis – An introductory textbook in English used at MIT. It covers the fundamentals of probability theory, including probabilistic models, discrete and continuous random variables, as well as more advanced topics, such as Bayesian inference and the Bernoulli and Poisson theorems.
- “Probability Theory and Mathematical Statistics” by N. Sh. Kremer is a textbook on the fundamentals of probability theory and mathematical statistics, with a solution guide. It includes examples of application in financial market models and production processes.
A Brief Introduction to Probability Theory
- Probability theory studies the patterns of random events. It helps analyze and predict various outcomes under conditions of uncertainty.
- Basic concepts of probability theory: probability, random event, probability distribution, and random variable.
- There are different mathematical models, or types of distributions, that describe probabilities, which are used depending on the problem. The main ones are discrete and continuous.
- Random number generation is divided into two main types: truly random and pseudo-random numbers. The former is based on physical processes such as atmospheric and thermal noise, radioactive decay, and so on, while the latter uses specialized algorithms.
- The most popular language for working with probability theory is Python. It’s simple and easy to use and contains a large number of libraries and frameworks.
- Programmers encounter probability theory when working in the fields of cryptography, machine learning, data science, and video game development.
Explore More IT Terms
#
A
- A Guide to SQL Query Formatting
- A/B testing
- Abstract Data Type (ADT)
- AES Encryption Algorithm: How It Works and Where It's Used
- Agile
- Algorithm
- Algorithm Analysis
- Algorithm Complexity
- Algorithm complexity: deep parsing O(log n)
- Algorithm vs. Program
- Algorithms and Data Structures in C#
- An overview of the C # programming language
- An overview of the Python programming language
- Anaconda Python
- Android
- Android App Bundle
- Android SDK
- Angular
- Ansible
- Apache
- Apache Airflow
- Apache Kafka
- Apache Tomcat
- App Store
- AppCode
- Applications of microcontrollers: From simple circuits in electronics to complex systems
- Applications of the derivative
- Arduino: How to Program It: Basics for Beginners
- Array-based stack
- ArrayList
- ASCII
- ASP.NET
- Assembly Language Lessons
B
C
D
- Data Analytics: applications of data analysis in companies
- Data Engineer - Who is it, what does a data engineer do, and an overview of the profession
- Data modeling: what it is, types, and process steps.
- Data preprocessing: a complete guide for beginners and professionals.
- Data structure
- Data Structures and Algorithms (DSA)
- Data types vs. Data structures
- Database Tests with Answers
- Deep Learning
- Defining Aliases
- Defining Arrays
- Deque
- Developing a Website from Scratch
- Differential Equations
- Differentiation of functions
- Digital data: understand the importance of this asset for businesses.
- Double integrals
- Doubly linked lists
- DSA Tutorial
E
F
G
H
- Handling errors and exceptions
- Heads or Tails? How Probability Theory Is Used in IT
- History of the development of computer science
- Homogeneous equations
- Homogeneous vs. non-homogeneous structures
- How to effectively organize your workflow
- How to Learn Java: Tips for Beginner Developers
- How to Learn PHP: A Beginner's Guide
- How to Use S3 Storage in Kubernetes with CSI
- HTML
- HTML and CSS: Definition, Application, and Operating Principles
- HTML and CSS. Layout from Scratch: What to Learn, Where to Learn, and How Long Will It Take?
- HTML Frame Structure
- HTML Link Formatting
I
- if..else construction
- Infinite sequences and series
- Information properties
- Inheritance in Java: A Complete Guide to Principles and Implementation
- Inserting an Image
- Integration of functions
- Interactive Python Tutorial – Learn Programming from Scratch
- Interpreter
- Interview Problem: Finding a Deleted Element in O(N)
- Interview Scare: The FizzBuzz Challenge
- Introduction to C++
- Introduction to Machine Learning
- Introduction to Networking | Network Fundamentals Part 1
- Introduction to Number Systems (Binary, Octal, Hexadecimal) | Math for CS Foundations #1
- IT Specialist Resume (CV)
J
K
L
M
- Machine Learning
- Machine Learning Basic Tool: NumPy
- Machine Learning Basic Tool: Pandas
- Machine Learning Mathematics
- Mathematics for programmers: what is really needed?
- MD5 encryption algorithm: What is it and why is it needed?
- Microcontroller and Microprocessor - what's the difference?
- ML Engineer: Who They Are, What They Do, How Much They Earn, and How to Become a Neural Network Specialist
- Monte Carlo Simulation: How It Works and What It's For
O
P
- PHP lessons
- Private DNS server and its configuration
- Program code
- Programmer's Dictionary
- Programming
- Programming with pseudocode
- Python Code Formatting Guide: PEP8
- Python for data analysis: how to do it and main libraries
- Python Lessons
- Python Superstar: 5 Ways to Use the * Operator
- Python vs. Julia: Should You Replace Python with Julia?
R
S
- SFML Graphics Library Tutorials
- Sorting Algorithms in Programming: Types, Descriptions, and Comparisons
- SQL commands: see what they are, what the main ones are + examples
- SQL Interview Questions and Tasks
- SQL Lessons
- SQL Stored Procedures
- SQL Syntactic Sugar: The COALESCE Function
- Stack
- Start in analytics: Python or R
- Static vs. dynamic data structures
- Statistical analysis: importance for decision making.
- String formatting in Python
- Structure of computer science
- Swift Lessons
- switch/match construct
- Syntax
T
- Terms in programming
- Text and paragraph formatting tags
- The concept of information and its transmission
- The Future of Python: Key Trends and Insights from Global Researc
- The Infrastructure of Code: A Complete Guide to Repositories for Languages, Frameworks, and Compilers
- The pip package manager in Python
- The role of informatization in the development of society
- Transfers
- Tutorials / Articles
- TypeScript: What It Is and Why Developers Need It
W
- What are databases, and why do they need DBMS and SQL?
- What do Linux distributions consist of?
- What is .NET and what is it used for?
- What is a data structure?
- What is a GPU in a computer, in simple terms?
- What is a quantum computer: 100,500 problems in one second
- What Is an Algorithm?
- What is Arduino: How it Works and the Platform's Capabilities
- What is Big Data? Introduction, Types, Characteristics, and Examples
- What is FizzBuzz Challenge?
- What is Golang and what is it used for?
- What is Haskell and what is it used for?
- What is Kotlin and what is it used for?
- What is Linux? The History of Linux
- What is machine learning, and how does it work?
- What is Power BI: everything about the data analytics software
- What is recursion, recursive and iterative process in programming?
- What is the C++ programming language?
- What is the OSI Model: A Complete Explanation of the Seven Layers and Their Role in Networking
- What's the difference between x86 and ARM processors?
- Where to start learning the C programming language?
- Which Linux distribution should you choose? A Linux distribution overview