
Do you know how to perform qualitative data analysis?
This model is part of the routine of Product teams and consists of an important skill for Product Managers and Product Designers who need to run experiments with users and adopt a Data Analytics strategy to make decisions.
Discover what qualitative data analysis is, the difference between qualitative and quantitative data, and the main characteristics of qualitative data. Also, learn when to analyze the data collected during research, how to do it efficiently, and 5 tools that can help in the qualitative research phase.
What is qualitative analysis?
Qualitative analysis, or qualitative data analysis, refers to the interpretation of data obtained through various qualitative research methods, such as:
- Research and interviews with users;
- Research using a focus group (which should discuss a topic or problem and can be done through brainstorming );
- Ethnographic studies;
- Usability testing;
- Observations regarding user or market behavior;
- Data from industry research and studies;
- Customer feedback and reviews.
Thus, qualitative research can involve direct interaction with users. Based on the information obtained through this model, the team performs a qualitative analysis of the data, which ranges from categorization to cross-referencing data to obtain more valuable insights.
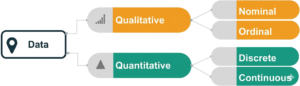
The difference between qualitative and quantitative data
While qualitative data refers to data that you cannot measure or quantify, quantitative data is expressed in numbers.
For example, assuming your product has recorded that 50 users logged in during a specific period of the day, that is quantitative data.
If you conducted user interviews and compiled the responses, or collected customer feedback regarding a feature, these are examples of qualitative data.
Although they are data with different characteristics, they are complementary and, when combined, help Product teams to have a more global view regarding a particular aspect or problem.
Characteristics of qualitative data
Qualitative data is more subjective and represents the individual user’s experience (or the experience of a specific group of people), such as when they provide an answer in an interview or give feedback or a review in an app store.
Considering the context of a product, this information can relate to users’ sensations, feelings, habits, preferences, and impressions.
Qualitative data are descriptive of a given context, not numerical like quantitative data. Therefore, this information builds a story and forms part of a narrative told by users in an interview, for example.
Examples of qualitative data in companies
Companies across various sectors use qualitative data to enrich their strategic decisions and better understand their customers. Qualitative data can include customer feedback, interviews, focus groups, and social media comments.
- Netflix – Analyzes user feedback to adjust recommendations and develop new series and films.
- Starbucks – Uses customer feedback on in-store experiences to modify products and services.
- Airbnb – Collects guest stories and reviews to better understand expectations and improve hospitality.
- Nike – Conducts focus groups to test new designs and technologies in sporting goods.
- Apple – Monitors product reviews and feedback on product launches to guide future improvements and innovations.
When to perform qualitative data analysis
Qualitative data analysis is recommended when the team needs to raise and validate hypotheses about a particular aspect. Qualitative research can be conducted to deepen the team’s understanding of user behavior with the product, understand the target audience, and identify market and customer needs, among other aspects.
Qualitative analysis can be used to understand the reasons behind user behavior, while quantitative research is commonly used to understand what is happening.
Furthermore, this method is efficient for understanding specific scenarios, understanding the user’s context, and identifying objective improvements in the journey.
Although this research model is quite efficient for obtaining valuable insights that can be applied to product improvements, ideally, the analysis of qualitative data should be combined with the analysis of quantitative information. This allows the company to draw more reliable and relevant conclusions for its processes and objectives.
Applications of qualitative data analysis
Qualitative data analysis is fundamental in various fields for extracting deep insights from human interactions and perceptions. It is used to improve customer experience, develop products, formulate public policies, and understand market dynamics.
Here are some important applications of qualitative data analysis:
- Improving the customer experience in services and products.
- Product development based on detailed user feedback.
- Formulating public policies based on interviews and focus groups.
- Market analysis to understand consumer trends and behaviors.
- Public health uses interviews to improve health services.
- Software development, using feedback to improve interfaces and functionalities.
- Education, to evaluate and improve teaching methods through feedback from students and teachers.
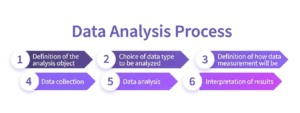
5 steps to perform data analysis in a qualitative research study.
After choosing the qualitative research method and gaining access to the data, it’s time to analyze it. There are several steps in qualitative analysis, such as:
1. Centralize the data
If your analysis includes data from different sources, it’s important to centralize the information in one place to facilitate the process.
2. Segment and categorize the data.
After gathering the information, it’s time to categorize the data. Observe common characteristics in the data and think about groups that can be created from these findings, including the data in the corresponding groups.
The importance of categories in qualitative research analysis lies in facilitating this process, since research can involve a large volume of information.
3. Identify patterns
With the data properly categorized, look for patterns that emerged in the responses, observations, and findings.
4. Cross-reference the data.
This step is important for making connections between the data and obtaining more relevant insights for your analysis, enriching the process. You can look for explanations for the information found or raise hypotheses that can be tested later.
5. Visualize the data
For more effective information compilation, it’s helpful to use data visualization tools to gain more clarity and enrich the analysis. This method also greatly assists in sharing data and insights with other team members and soliciting feedback.
These data analysis techniques are not a rule; you can adapt them according to the insights obtained or the research objectives. But, in general, these steps bring more clarity to your analyses and allow you to evaluate a good volume of data.
5 tools for conducting qualitative research
There are several tools specifically designed for PMs to perform data analysis and help map user behavior, as well as collect and process large volumes of qualitative data, such as feedback and responses, and quantitative data. Learn about some of them below!
1. Sense Data
SenseData is a well-known Customer Success tool that gathers valuable data about your customers’ journey, increasing the predictability of cancellations and allowing you to identify user behavior to optimize cross-selling and up-selling strategies.
2. Hotjar
Hotjar is a platform created to streamline data collection and analysis, making the process visual and collaborative. The tool is equipped with features to collect user feedback, run surveys with them, identify key customer needs, and understand user behavior with your product.
3. Gainsight
Gainsight is a tool focused on Customer Success and user experience with the product. With it, you can map customer needs and visualize user behavior at each touchpoint in their journey.
4. Amplitude
Amplitude is one of the most widely used Product Analytics platforms for collecting product data and performing qualitative and quantitative analyses to optimize your solution’s performance and user experience. With the platform, you can map people‘s behavior within your product, with real-time updates on interactions.
5. Full Story
The FullStory platform allows you to combine quantitative and qualitative analyses of your users’ behavior, with the goal of increasing product engagement, optimizing conversions, and identifying friction points in the customer journey.
The tool allows you to collect all the data regarding user interactions with your product, helping companies to digitize their processes.
Ethics in the analysis of qualitative data
The analysis of qualitative data in the development of digital products involves a series of ethical considerations that are fundamental to ensuring integrity and trust in research and development processes.
Research ethics is guided by principles that seek to protect the rights of participants, ensure the confidentiality and privacy of information, and minimize any potential harm.
- Informed consent and voluntariness: All research participants must be fully informed about the purpose, methods, and potential risks and benefits of the study.
- Privacy and confidentiality: Researchers should take steps to ensure that personal information is kept secret and that access to this data is limited to authorized individuals.
- Transparency and accountability: Research procedures and results must be communicated clearly and transparently. This includes disclosing any conflicts of interest and ensuring that results are reported honestly and accurately.
- Legal and regulatory compliance: In addition to following ethical guidelines, research must comply with all applicable laws and regulations. This includes obtaining all necessary ethical approvals before commencing the research.
Frequently asked questions about qualitative data analysis
What are the main challenges faced when conducting qualitative data analysis, and how can they be overcome?
The main challenges in qualitative data analysis include dealing with the subjectivity and complexity of the data, which can vary widely and be open to multiple interpretations.
To overcome these challenges, it is crucial to adopt rigorous and consistent methods for data collection and analysis, use coding tools to organize and synthesize information, and promote data triangulation, using multiple sources or methods to verify results.
The formation of multidisciplinary teams can also help ensure a more balanced and less biased analysis.
Are there specific examples of how companies have successfully used qualitative data to guide important strategic decisions?
Yes!
For example, Starbucks used customer feedback to improve products and the in-store experience, leading to the creation of new products and service offerings. Netflix also analyzes user reviews and ratings to adjust its recommendation algorithm and develop original content that resonates better with its audience.
These strategies help companies adapt to consumer preferences and innovate more effectively.
How can we ensure objectivity and reduce bias in the interpretation of qualitative data during analysis?
To ensure objectivity and reduce bias in the analysis of qualitative data, it is essential to adopt clear and standardized data collection and analysis procedures.
Including multiple analysts can help provide diverse perspectives and reduce individual subjectivity. Furthermore, using specialized software for qualitative analysis can aid in organizing and coding data systematically, minimizing biased interpretations.
Peer review within the analytical process also contributes to greater validation and reliability of the interpretative results.
Want to know more? We’re just a click away!
If you have any questions about how data analysis can help with your challenges, we’re here for you. Contact the 365education team via WhatsApp right now. Contact us.