
A/B testing
This method is often used in website and mobile app development to evaluate improvements that can increase traffic and conversion, reduce bounce rates, extend session duration, and more. It is used by product and data analysts, web developers, internet marketers, and other specialists. A/B testing allows you to build and test hypotheses to determine which changes to make to your product to improve its performance.
What is testing for?
Many specialists make changes to a product based on their intuition, personal experience, etc. This leads to a percentage of decisions that do not correspond to objective reality and prove ineffective.
In developing and testing hypotheses, A/B testing allows you to solve the following problems:
- understand the real needs, habits, and behavior of users and the objective factors that influence them;
- reduce the risks associated with the influence of the developer’s subjective perception on decisions made;
- correctly allocate resources to implement effective solutions.
In web development, the following elements are tested using this technique:
- text content (content, structure, volume, font);
- design, size, and location of conversion buttons and forms;
- logo and other elements of corporate identity;
- web page design and layout;
- price of goods, various discounts and promotions;
- unique selling proposition;
- product images and other visual materials.
Types of A/B testing
Simple A/B test (split test)
This is a classic method that compares two variants (a control and a test) of the object being studied, differing in only one parameter. For example, a landing page with a blue and a yellow call-to-action button (see screenshot). This type of test is effective for making targeted changes that don’t affect the overall performance of the site.
Multivariate testing
Two variants (control and test) of several elements in various combinations are compared. For example, you can simultaneously analyze a target action button, a testimonial block, a logo, and so on. Multivariate testing is more complex, but it allows you to analyze the impact on the audience not only of each element individually, but also of their combinations.
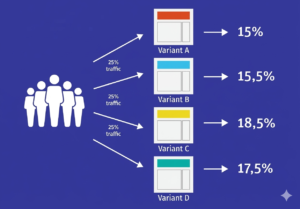
A/B/n test
One or more variations are launched simultaneously on the original page. Conversion rates are compared across variations based on a single change to obtain results. For example, landing pages with rectangular, round, triangular, and trapezoidal action buttons. A/B/n testing allows you to choose the most suitable solution from several proposed variations.
How to conduct testing?
Let’s examine A/B testing using a classic split test as an example, as the other two types are generally performed using the same algorithm. The only difference is the number of variants being tested. Split testing is an experimental statistical research method, so its effectiveness directly depends on adherence to several strict rules.
Goals and metrics. Before conducting an A/B test, you need to clearly understand the desired outcome. This could be an increase in traffic or conversion, a reduction in bounce rate, etc. Depending on the goal, metrics are selected—quantitative indicators that determine the effectiveness of the changes being made. For example, the number of orders, the average order value, or the open rate of emails in a newsletter.
Hypothesis. The results of A/B testing directly depend on the stated assumption that needs to be tested. The hypothesis should include the object being analyzed, its change, and the expected results. The general assumption is divided into two sub-assumptions:
- null hypothesis – the changes made will not produce results, and all deviations are due to chance;
- Alternative hypothesis – Option B will show a statistically significant result.
Number of variables to test. Every website or mobile app contains dozens of elements that somehow influence the user experience and, consequently, traffic, conversion, and other target metrics. Testing several or all of them at once is not the best option, as it will be difficult to determine after testing which variable had the decisive impact on the results. Therefore, for a single split test, only one element should be tested (though there can be more than two variations).
Audience distribution. To ensure a fair split test, traffic must be randomly and equally distributed between the control and test variants. Users who see version A should not see version B. If the product is already in use and undergoing further improvements (for example, if a parallel advertising campaign is being run), to ensure reliable results, traffic should be divided not into two, but three groups: A, A, and B. The first two groups are shown the control version of the product, and the third, the test variant. If the results in the first two groups are identical, external factors have not affected the validity of the test, and the results can be trusted.
Sample size. To obtain statistically significant results, it’s necessary to calculate the size of the audience that will be shown the control or experimental version of the product. This figure is influenced by various parameters, including the personal preferences of the experimenter. Sample size can be calculated manually or using specialized services such as Driverback or Optimizely.
Significance threshold. This is a measure of the difference between the results of the control and experimental groups that is due to chance. The standard significance threshold is 0.05, meaning that 5% of the deviations are insignificant for the experiment. The lower this threshold, the lower the risk of detecting random data in the experimental results. Online split-testing services automatically select the significance threshold.
Test Timing. To ensure reliable, not random, results, split testing must be conducted over a specific period of time. Ending the test prematurely can lead to a peeking error. Even if the result is statistically significant, it doesn’t guarantee the validity of the result until the testing period is complete. If you’re analyzing a website, you can calculate the testing time based on daily traffic. On average, two weeks is enough to conduct an objective test. To eliminate the influence of external factors (such as seasonality, exchange rates, weather, etc.), the control and test variants should be tested simultaneously.
Analysis of results
At the end of an A/B test, the results of groups A and B should be compared with each other, and the resulting difference (if any) should be measured against the significance threshold. It’s also important to evaluate whether the metric value changed positively or negatively in variant B. This will help you understand the feasibility of the changes.
If a split test doesn’t reveal a significant difference between the overall performance of metrics A and B, you can try segmenting them. For example, changing a subscribe button from a rectangular to a round one didn’t result in an increase in orders, but it did improve engagement among female audiences. Such segmentation can be performed by geographic parameters, platform type (desktop or mobile), gender, age, traffic source, and so on.
For example, if the landing page being tested differs from the original only by a slightly larger button, it’s unlikely to have a significant impact on conversion. However, even this result can improve the site’s performance.
If testing is conducted correctly and yields statistically significant results, and the changes are proven effective, there’s no reason to stop. Firstly, on a landing page, in addition to the target action button, there’s a headline, main text, images and photos, a widget indicating the promotion’s expiration date, and many other elements. All of these influence user behavior. Secondly, it’s recommended to run multiple test iterations for the same element, with each new control variant using the experimental version from the previous test.
A/B testing tools
Conducting a split test requires a large audience sample. This is a complex process, especially if respondents from the control and experimental groups are located in different parts of the country or even the world. Therefore, various online services can be used to speed up testing and reduce the likelihood of error.
Google Optimize. This service is part of the Google Marketing Platform. It allows you to test various page elements, including headlines, fonts, conversion buttons and forms, images, text, and more. The service can be integrated with Google Analytics for segmentation and goal setting, as well as with Firebase, Google AdWords, and other Google products. A free version is available.
Optimizely. One of the most popular paid services. Pricing is calculated individually after consultation with the sales team. Optimizely is highly personalized and flexible, but it cannot integrate with Google products.
Visual Website Optimizer is a paid online service. Subscriptions range from $99 to $999 per month. It allows you to configure over 15 parameters for experiments and partially integrates with Google Analytics, but does not allow goal import. A 30-day trial is available with a traffic limit of 1,000 visitors.

AB Tasty. Another English-language resource with a simple and intuitive interface, a wide range of features, flexible customization, and personalization. It can be integrated with Google services for targeting and goal setting, and features automated messaging tools. Subscriptions range from $39 for 5,000 visitors per month to $390 for 200,000 users per month.
A/B testing is a versatile, reliable, and proven method of marketing research. When conducted correctly, it can provide objective insight into how to improve a product. However, don’t rely solely on it. To obtain the most objective data, A/B testing should be combined with other marketing research methods.
Explore More IT Terms
#
A
- A Guide to SQL Query Formatting
- A/B testing
- Agile
- Algorithm complexity in 5 minutes
- Algorithms and Data Structures in C#
- An overview of the C # programming language
- An overview of the Python programming language
- Anaconda Python
- Android
- Android App Bundle
- Android SDK
- Angular
- Ansible
- Apache
- Apache Airflow
- Apache Kafka
- Apache Tomcat
- App Store
- AppCode
- Applications of the derivative
- Array-based stack
- ArrayList
- ASCII
- ASP.NET
- Assembly Language Lessons
B
C
D
- Data Analytics: applications of data analysis in companies
- Data Engineer - Who is it, what does a data engineer do, and an overview of the profession
- Data modeling: what it is, types, and process steps.
- Data preprocessing: a complete guide for beginners and professionals.
- Data structure
- Data structures
- Defining Aliases
- Defining Arrays
- Deque
- Developing a Website from Scratch
- Differential Equations
- Differentiation of functions
- Digital data: understand the importance of this asset for businesses.
- Double integrals
- Doubly linked lists
E
F
H
- Handling errors and exceptions
- How to effectively organize your workflow
- How to Learn Java: Tips for Beginner Developers
- How to Learn PHP: A Beginner's Guide
- How to Use S3 Storage in Kubernetes with CSI
- HTML
- HTML and CSS: Definition, Application, and Operating Principles
- HTML and CSS. Layout from Scratch: What to Learn, Where to Learn, and How Long Will It Take?
- HTML Frame Structure
- HTML Link Formatting
I
- if..else construction
- Infinite sequences and series
- Inheritance in Java: A Complete Guide to Principles and Implementation
- Inserting an Image
- Integration of functions
- Interactive Python Tutorial – Learn Programming from Scratch
- Interview Problem: Finding a Deleted Element in O(N)
- Interview Scare: The FizzBuzz Challenge
- Introduction to C++
- Introduction to Machine Learning
- Introduction to programming languages
- IT Specialist Resume (CV)
J
K
M
O
P
- PHP lessons
- Private DNS server and its configuration
- Programmer's Dictionary
- Programming with pseudocode
- Python Code Formatting Guide: PEP8
- Python for data analysis: how to do it and main libraries
- Python Lessons
- Python Superstar: 5 Ways to Use the * Operator
- Python vs. Julia: Should You Replace Python with Julia?
S
- SFML Graphics Library Tutorials
- SQL commands: see what they are, what the main ones are + examples
- SQL Interview Questions and Tasks
- SQL Lessons
- SQL Stored Procedures
- SQL Syntactic Sugar: The COALESCE Function
- Stack
- Start in analytics: Python or R
- Statistical analysis: importance for decision making.
- String formatting in Python
- Swift Lessons
- switch/match construct
T
W
- What are databases, and why do they need DBMS and SQL?
- What do Linux distributions consist of?
- What is .NET and what is it used for?
- What is a GPU in a computer, in simple terms?
- What is Big Data? Introduction, Types, Characteristics, and Examples
- What is Golang and what is it used for?
- What is Haskell and what is it used for?
- What is Kotlin and what is it used for?
- What is Linux? The History of Linux
- What is machine learning, and how does it work?
- What is Power BI: everything about the data analytics software
- What is the C++ programming language?
- What is the OSI Model: A Complete Explanation of the Seven Layers and Their Role in Networking
- What's the difference between x86 and ARM processors?
- Where to start learning the C programming language?
- Which Linux distribution should you choose? A Linux distribution overview