K-means and Elbow Clustering: Data Clustering with Examples in Python
- What is the k-means algorithm and how does it work?
- The main stages of the k-means algorithm
- Advantages and disadvantages of k-means
- What is the elbow method, or how to choose the optimal number of clusters
- Other methods for choosing the number of clusters
- How to Write K-Means Clustering in Python
- Where is the k-means algorithm used in real practice?
Data clustering is a key task in machine learning. It allows objects to be grouped into homogeneous clusters based on their characteristics. One of the most popular, simple, and effective clustering methods is the k-means algorithm.
We’ll look at how k-means works, introduce the elbow method for determining the number of clusters, and illustrate its application to real data using the Python programming language.
What is the k-means algorithm and how does it work?
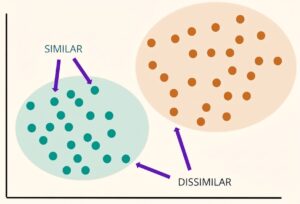
The k-means algorithm is used to group objects into sets (clusters) based on their similarity. K-means operates by minimizing the distance between objects within a cluster.
Imagine you have a lot of colorful balloons. You need to divide them into several groups so that each balloon in a group is similar to the others. The algorithm helps you find the best way to group these balloons so that they are as similar as possible within each group.
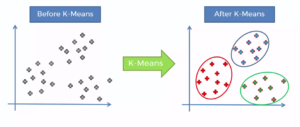
It works like this: first, several centers are selected for groups (for example, three centers for three groups). The algorithm then distributes all the balls into groups, determining which center they are closest to. After this, it recalculates the centers for new groups and repeats the process until the centers no longer vary significantly. This allows for the creation of groups with balls that are similar to each other.
The main stages of the k-means algorithm
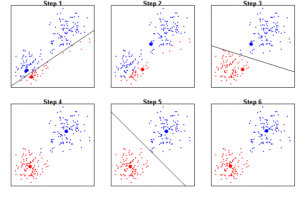
The k-means algorithm can be described in several steps:
- Selecting the number of clusters (k). The first step is to determine the number of clusters into which the data will be divided. This parameter is set manually, and its correct selection directly impacts the quality of clustering.
- Centroid initialization. The algorithm randomly selects k starting points, called centroids. These points serve as temporary cluster centers.
- Assigning objects to clusters. Each object in the dataset is assigned to the cluster whose centroid is closest. The Euclidean distance is typically used to calculate distance, but other similarity measures are also available, such as the cosine distance or the Manhattan distance.
- Centroid update. After objects are assigned to clusters, new centroids are calculated. Each centroid is moved to the midpoint of all objects belonging to its cluster.
- Iteration. Steps 3 and 4 are repeated until the centroids stop changing significantly, indicating convergence. In some implementations, the algorithm may also terminate once a specified number of iterations is reached.
Advantages and disadvantages of k-means
Advantages
- Simplicity and speed of implementation.
- Efficiency when working with large data sets.
- Can be applied in various fields such as customer segmentation, image processing, social media analysis, and others.
Disadvantages
- Dependence on the choice of the number of clusters (k).
- Sensitivity to the initialization of centroids. Different initializations can lead to different results.
- Performs poorly on data containing outliers or complex cluster shapes, such as overlapping or nonlinear clusters.
- Not suitable for categorical data without prior transformation.
What is the elbow method, or how to choose the optimal number of clusters
One of the most challenging steps of the k-means algorithm is choosing the optimal number of clusters, k. If k is too small, a single cluster may contain too many different objects, which will degrade clustering quality. If k is too large, the clusters may become too small and specific, which will also lead to poor results. Several methods can be used to choose the optimal number of clusters, and one of the most popular is the elbow method.
Elbow Method: How it Works
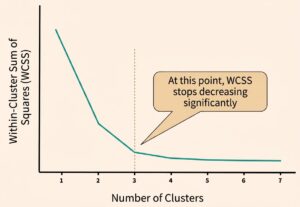
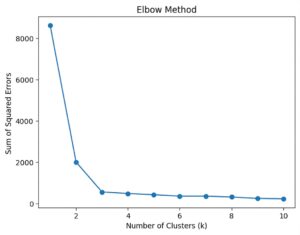
The elbow method involves performing clustering for different values of k and plotting the total within-cluster variance as a function of the number of clusters. Within-cluster variance (or the sum of the squared distances between objects and their centroid) indicates how compact the clusters are. The smaller the within-cluster variance, the more “ordered” and “homogeneous” the clusters are.
To use the elbow method:
- We run the k-means algorithm for different values of kkk, for example from 1 to 10.
- We calculate the within-cluster variance for each kkk value. This can be done using a metric that calculates the sum of the squared distances between data points and their cluster centroid.
- We plot a graph: on the X-axis we plot the kkk values, and on the Y-axis we plot the corresponding values of intra-cluster dispersion.
- We look for the “elbow” on the graph: this is the point where a further increase in the number of clusters does not lead to a significant decrease in intra-cluster dispersion.
The point on the graph where the variance drops significantly, and then becomes less noticeable, is called the elbow. This is the optimal number of clusters.
Why is the method called the “elbow method”?
The method’s name derives from the shape of the graph obtained during its application. If the values of k and the intracluster variance are plotted on a graph, the graph will appear as an angular line that drops sharply to a certain point and then continues to decline, but more slowly. This elbow-like angle is the “elbow” we’re looking for.
Disadvantages of the elbow method
Despite its popularity and simplicity, the elbow method has several limitations:
- Difficulty in interpretation. In some cases, the graph may contain multiple “elbows,” making it difficult to choose the optimal number of clusters.
- Data Dependency: The elbow method may not work well for data with a very complex structure or high dimensionality.
- Assumptions about cluster shapes. The elbow method assumes that clusters will be compact and similar in size. Otherwise, the method may not yield the correct answer.
Other methods for choosing the number of clusters
Besides the elbow method, there are other approaches to choosing the optimal number of clusters:
- The silhouette method measures how well objects can be divided into clusters. The higher the silhouette value, the better an object fits into its cluster.
- The gap statistic method compares the internal variance of clusters with the variance of clusters obtained from random data. This helps select the optimal number of clusters.
- Hierarchical clustering does not require a predetermined number of clusters and helps you understand how many clusters best fit your data.
How to Write K-Means Clustering in Python
Step 1. Installing libraries
First, make sure you have the necessary libraries installed. We’ll be using NumPy, Matplotlib, and scikit-learn for data clustering and visualization. You can install them using the command:
Step 2: Importing Libraries
First, let’s import the necessary libraries:
- NumPy is used to work with arrays of data.
- Matplotlib will help you visualize the results.
- KMeans is a class from the scikit-learn library that implements the k-means algorithm.
Step 3: Creating Data
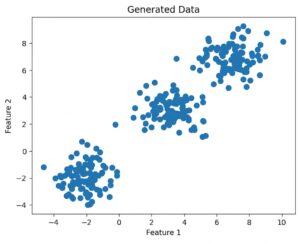
For this example, we’ll create some simple data to cluster. In real life, data can come from a variety of sources (e.g., CSV files, databases ), but for convenience, we’ll generate the data here using NumPy:
This code generates 300 data points, divided into three groups with different means and standard deviations. After generating the data, we visualize it to see how it is distributed.
Step 4. Applying the k-means method
Now that we have the data, let’s apply the k-means algorithm to cluster it. We’ll use three clusters, as we know the data was generated with three centers.
In this code:
- n_clusters=3 indicates that we want to split the data into three clusters.
- The fit() method trains the model, and labels_ returns an array of labels for each object indicating which cluster it was assigned to.
- cluster_centers_ contains the coordinates of the cluster centers.
Step 5. Visualizing the results
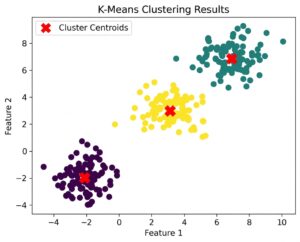
Once the model is trained, you can visualize the clustering results. We’ll show the data and cluster centers on a graph:
Here:
- We visualize the data colored by clusters (using c=labels).
- Cluster centers are shown as red crosses.
Step 6. Assessing the quality of clustering (elbow method)
To determine the optimal number of clusters for your data, you can use the elbow method. We’ll plot the sum of intra-cluster distances as a function of the number of clusters and look for the point where the graph begins to “flatten out.”
Here:
- inertia_ is the sum of the squares of the distances between objects and their centroid, that is, the intra-cluster dispersion.
- We calculate the inertia for different values of kkk and plot a graph.
On the graph, you should see an “elbow” point where adding new clusters stops significantly reducing the intra-cluster distance.
Step 7. Selecting the optimal number of clusters
Once you find the elbow point, that will be the optimal number of clusters for your data. For example, if the graph shows that inertia begins to decrease significantly more slowly after k = 3, this means that the optimal number of clusters for your dataset is three.
And these are the graphs we got:
Where is the k-means algorithm used in real practice?
The k-means algorithm is used in many fields to solve problems related to data clustering. Here are some practical examples:
- Image processing
K-means is often used for image segmentation. For example, to divide an image into multiple parts (to isolate objects or textures). It can be useful in computer vision for object recognition, noise filtering, or medical image analysis.
- Text analysis
In natural language processing (NLP), k-means is used for text clustering. This helps group documents, articles, or messages that share a similar topic, sentiment, or content. It is used in recommendation systems, such as news aggregators or search engines.
- Anomaly detection
The k-means algorithm is used to identify anomalous or suspicious data that does not match expected patterns. This is important for security monitoring systems or financial transaction analysis.
- Recommender systems
K-means helps create recommender systems by analyzing user behavior and preferences. Segmenting users into clusters improves the accuracy of recommendations.
Explore More IT Terms
#
- Using an integrating factor
- Equations in total differentials
- Bernoulli's equation
- Linear differential equations of the first order
- 10 Mixed C++ Challenges to Test Your Skills
- 11 Tricky Non-Technical Questions to Ask in a Recruiting Interview
- 50 Terms Every Programmer Should Know
- 52 Java Thread Interview Questions
- 7 Levels of Using the Zip Function in Python
- 7 Python Code Bugs You Need to Fix
- 70+ Free Resources for Learning Programming
A
- A Comprehensive Guide to HTML and CSS
- A Comprehensive Guide to MODX CMS
- A computer science question tests your ability to work with IP addresses and network masks
- A Guide to SQL Query Formatting for Beginners
- A/B testing
- Abstract Data Type (ADT)
- AES Encryption Algorithm: How It Works and Where It's Used
- Agile
- Algorithm
- Algorithm Analysis
- Algorithm Complexity-Key Points
- Algorithm complexity: deep parsing O(log n)
- Algorithm vs. Program
- Algorithms and Data Structures in C#
- An overview of the C # programming language
- An overview of the Python programming language
- Anaconda Python
- Analysis of graphs and adjacency matrices question
- Android
- Android App Bundle
- Android SDK
- Angular
- Ansible
- Apache
- Apache Airflow
- Apache Kafka
- Apache Tomcat
- App Store
- AppCode
- Applications of microcontrollers: From simple circuits in electronics to complex systems
- Applications of the derivative
- Arduino: How to Program It: Basics for Beginners
- Array-based stack
- ArrayList
- ASCII
- ASP.NET
- Assembly Language Lessons
B
C
- C++ Lessons
- Cache
- Calculating Memory Capacity
- Character sets and encodings
- Characteristics of a good Algorithm
- Circular singly linked list
- Coding Tests with Answers
- Combinational Circuits Solved Questions
- Compiler
- Complexity of algorithms-Tutorial
- Computer Science Fundamentals Test with Answers (47 questions)
- Computer science tests with answers (More than 100 Questions)
- Constants
- Creating a Table in HTML
- Creating Forms in HTML
- Creating Lists
- Cybernetics and informatics
- Cycles
D
- Data Analytics: applications of data analysis in companies
- Data Engineer - Who is it, what does a data engineer do, and an overview of the profession
- Data modeling: what it is, types, and process steps.
- Data preprocessing: a complete guide for beginners and professionals.
- Data structure
- Data Structures and Algorithms (DSA)
- Data types vs. Data structures
- Database Tests with Answers
- Deep Learning
- Defining Aliases
- Defining Arrays
- Deque
- Detailed articles and tutorials on PHP
- Developing a Website from Scratch
- Differential Equations
- Differentiation of functions
- Digital data: understand the importance of this asset for businesses.
- Double integrals
- Doubly linked lists
- DSA Tutorial
E
F
G
H
- Handling errors and exceptions
- Heads or Tails? How Probability Theory Is Used in IT
- History of the development of computer science
- Homogeneous equations
- Homogeneous vs. non-homogeneous structures
- How to convert numbers between binary, octal, and hexadecimal number systems
- How to effectively organize your workflow
- How to Learn Java: Tips for Beginner Developers
- How to Learn PHP: A Beginner's Guide
- How to Use S3 Storage in Kubernetes with CSI
- HTML
- HTML and CSS: Definition, Application, and Operating Principles
- HTML and CSS. Layout from Scratch: What to Learn, Where to Learn, and How Long Will It Take?
- HTML Frame Structure
- HTML Link Formatting
- HTML Quizzes with Answers
I
- if..else construction
- Infinite sequences and series
- Information properties
- Inheritance in Java: A Complete Guide to Principles and Implementation
- Inserting an Image
- Integration of functions
- Interactive Python Tutorial – Learn Programming from Scratch
- Interpreter
- Interview Problem: Finding a Deleted Element in O(N)
- Interview Scare: The FizzBuzz Challenge
- Introduction to C++
- Introduction to Machine Learning
- Introduction to Machine Learning with Python
- Introduction to Networking | Network Fundamentals Part 1
- Introduction to Number Systems (Binary, Octal, Hexadecimal) | Math for CS Foundations #1
- IT Specialist Resume (CV)
J
K
L
M
- Machine Learning
- Machine Learning Basic Tool: NumPy
- Machine Learning Basic Tool: Pandas
- Machine Learning Basics
- Machine Learning Mathematics
- Machine Learning with Python
- Mathematics for programmers: what is really needed?
- MD5 encryption algorithm: What is it and why is it needed?
- Microcontroller and Microprocessor - what's the difference?
- ML Engineer: Who They Are, What They Do, How Much They Earn, and How to Become a Neural Network Specialist
- Monte Carlo Simulation: How It Works and What It's For
O
P
- PHP lessons
- Private DNS server and its configuration
- Program code
- Programmer's Dictionary
- Programming
- Programming with pseudocode
- Python Code Formatting Guide: PEP8
- Python for data analysis: how to do it and main libraries
- Python Lessons
- Python Superstar: 5 Ways to Use the * Operator
- Python vs. Julia: Should You Replace Python with Julia?
Q
R
S
- Setting up model parameters
- SFML Graphics Library Tutorials
- Sorting Algorithms in Programming: Types, Descriptions, and Comparisons
- SQL commands: see what they are, what the main ones are + examples
- SQL Interview Questions and Tasks
- SQL Lessons
- SQL Stored Procedures
- SQL Syntactic Sugar: The COALESCE Function
- Stack
- Start in analytics: Python or R
- Static vs. dynamic data structures
- Statistical analysis: importance for decision making.
- String formatting in Python
- Structure of computer science
- Supervised learning
- Swift Lessons
- switch/match construct
- Syntax
T
- Terms in programming
- Text and paragraph formatting tags
- The Complete Guide to Bootstrap
- The Complete Guide to JavaScript
- The concept of information and its transmission
- The Future of Python: Key Trends and Insights from Global Researc
- The Infrastructure of Code: A Complete Guide to Repositories for Languages, Frameworks, and Compilers
- The pip package manager in Python
- The role of informatization in the development of society
- Transfers
- Tricky Java Questions Often Asked in Interviews
- Tutorials / Articles
- TypeScript: What It Is and Why Developers Need It
W
- What are databases, and why do they need DBMS and SQL?
- What do Linux distributions consist of?
- What is .NET and what is it used for?
- What is a data structure?
- What is a GPU in a computer, in simple terms?
- What is a quantum computer: 100,500 problems in one second
- What Is an Algorithm?
- What is Arduino: How it Works and the Platform's Capabilities
- What is Big Data? Introduction, Types, Characteristics, and Examples
- What is FizzBuzz Challenge?
- What is Golang and what is it used for?
- What is Haskell and what is it used for?
- What is Kotlin and what is it used for?
- What is Linux? The History of Linux
- What is machine learning, and how does it work?
- What is Power BI: everything about the data analytics software
- What is recursion, recursive and iterative process in programming?
- What is the C++ programming language?
- What is the OSI Model: A Complete Explanation of the Seven Layers and Their Role in Networking
- What's the difference between x86 and ARM processors?
- Where to start learning the C programming language?
- Which Linux distribution should you choose? A Linux distribution overview