
From Data to Decisions: What is DWH and How Does Analytics Work with It?
Imagine a marketer asks for a report on yesterday’s promotion. The sales team complains about discrepancies between the data and the financials. And you, the analyst, instead of searching for insights, spend the entire day chasing numbers: downloading logs from one system, cleaning CSV files from another, trying to summarize them in Excel, and praying that the final figures will match. Most of the workday is spent not on analysis, but on fighting data chaos.
A Data Warehouse (DWH) can help avoid this. This article will explain how daily work with a data warehouse transforms the chaotic collection of metrics into an efficient process, where most of the time is spent not on preparing information, but on analyzing it, finding insights, and generating business recommendations.

DWH in simple terms: a single brain for company data
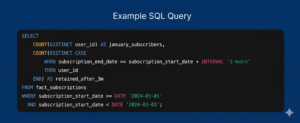
Let’s say a music streaming analyst is tasked with finding out how many users signed up in January and how many of them remained with the service after three months.
This will require data from different systems.
- From the app’s database: a list of users who clicked the “Subscribe” button in January.
- From the payment system: information on successful withdrawals for January, March, and April (to confirm that the subscription is active).
- From CRM: information about tariffs or promotions that people have signed up for.
Without DWH, an analyst’s day would turn into a digital archaeology quest.
- Write a complex query to the application database to download 50,000 rows of user IDs for users who started signing up in January.
- Contact your colleague in the payments department and request access to their system. The table structure there is completely different, and the field names don’t match. Write a second query to find successful transactions.
- Clean data in huge Excel files.
As a result, 80% of the time is spent searching for the necessary information, and the business problem has not even begun to be solved.
DWH is changing the situation.
A Data Warehouse (DWH) is a centralized repository where data from all company systems is regularly collected, cleaned, and logically organized. It is stored here in an analytical format and with a history of changes, allowing for quick answers to business questions.
With storage, an analyst’s work speeds up significantly. Let’s get back to streaming.
1. Connect to DWH. For example, through a tool like SQL or a BI system.
2. Write one direct and simple query.
3. Get an answer in seconds instead of days or hours.
The specialist saves time, which could be spent on analysis. “Why did this particular group of users stay? Perhaps they listened to playlists more often? And those who left—did they have technical errors when making payments?” And they immediately move on to generating hypotheses and searching for insights.
Briefly
Who uses Data Warehouse and how:
- analysts – create reports and dashboards;
- product teams – look at metrics and hypotheses;
- Business – makes decisions based on numbers.
Most often, storage is accessed through:
- SQL queries,
- BI tools (dashboards and reports).
If an analyst is the primary user and researcher of a DWH, then a data engineer is its architect and builder. This specialist designs and creates the warehouse itself, ensuring the uninterrupted flow of high-quality information from all corners of the company to a single analytical center. Want to master this complex, yet interesting and highly sought-after profession? Take the “Data Engineer” course. The program is designed for professionals who strive for the systemic design of complex solutions.
What DWH is not: Key differences from a database
By “regular” database (usually an OLTP system), we mean a production, operational database. Its purpose is to support the daily operation of an application or service—to place an order, charge a fee, or update a status. It records data quickly, but is poorly suited for analysis. History can be overwritten, the structure can change, and complex analytical queries can slow down the system.
The Data Warehouse is designed differently. It doesn’t directly serve users and isn’t involved in transactions. Its purpose is to store clean, consistent, and historical data so that analysts can confidently ask complex questions: compare periods, segments, channels, and metrics without risking production downtime.
| Regular DB (OLTP – transaction processing) | Data Warehouse (DWH – analytical processing) | |
| The main goal | Operational work. Supporting daily business processes in real time. | Analytics and decision support. Analysis of historical data to identify trends and make forecasts. |
| Basic operations | CRUD: Frequent short write and update operations (INSERT, UPDATE, DELETE). Reads are for a specific record (for example, find order #123). | Reading and aggregation. Very infrequent writes (usually bulk loading). Frequent complex read queries (SELECT) traversing millions of rows. |
| Data structure | Normalized. Many related tables. | Denormalized (often). Wide tables ready for analysis. For example, all sales data in one row: product, customer, store, discount. |
| Scale of requests | Processes large numbers of simple transactions (thousands per second). Example: “Change the status of order 1 to ‘delivered’.” | Processes a small number of very complex queries (several per minute/hour). Example: “Revenue for all regions over the past 5 years, broken down by product category.” |
| Data sources | Typically, one source is the application it serves. | Multiple sources: data from multiple OLTP databases, log files, external APIs. For example, weather data for demand analysis. |
| Time horizon | Mostly current, up-to-date data. Old data is often archived or deleted. | Stores historical data for years to see trends. |
| Performance | Optimized for writing speed and key search. | Optimized for high-speed reading of large volumes and complex joins (JOINs). |
Briefly
- The operations base is responsible for what is happening right now.
- Data Warehouse – What’s Really Happening to Business and Why.
Why businesses need to implement DWH
When a company doesn’t have a unified data warehouse, analytics often looks like this: different teams produce different figures, reports don’t agree, and debating whose numbers are more accurate takes more time than finding solutions. As a result, the business either makes decisions based on incomplete data or postpones them altogether.
DWH transforms disparate sources into a unified system of coordinates, where metrics are defined once and used by everyone. For the company, this means more than just reports, but the ability to quickly obtain answers and rely on them for management.
What problems does it solve?
Data consolidation
All key company data—sales, users, finances, marketing—is collected in one place. Analysts don’t need to manually reconcile data or explain discrepancies: the sources are already linked and synchronized.
For example, the warehouse could compare data on call center performance (average resolution time) with information on customer repeat purchases. This could then prove the hypothesis: “Customers whose issues were resolved within 10 minutes are twice as likely to make a repeat purchase.”
Quality and uniform logic
DWH establishes common definitions of metrics: what counts as revenue, an active user, or a conversion. This reduces errors and disputes between teams and makes analytics reproducible.
Specialists no longer waste time coordinating methodology. We take a ready-made, documented metric—for example, the is_active_user column in the user_activity_daily table —and confidently use it in calculations. Analyst reports are always consistent with those of colleagues, and their results can be reproduced at any time.
Speed of decision making
When data is ready for analysis, businesses get answers faster. Analysts spend less time preparing and more time interpreting, finding patterns, and testing hypotheses.
Examples from industries
Retail
The analyst consolidates sales, inventory, and promotion data in DWH and quickly identifies which products are losing margins and why. Assortment and pricing decisions are based on the overall picture, not individual reports.
Conditional task: to optimize warehouse stocks and increase product turnover.
- The warehouse collects data daily from 1C, the warehouse accounting system, and individual tables from purchasing agents.
- A single analytical showcase inventory_management is created inside.
- It automatically calculates key metrics for each SKU in each store: current inventory, average daily sales, and depletion forecast (days remaining).
An analyst or even a manager can use a BI dashboard to identify red zones—items with less than three days’ supply left. Purchasing becomes fact-based, losses from shortages or surpluses are reduced, and inventory turnover increases.

Fintech
A data warehouse allows you to connect transactions, user behavior, and product events. A specialist can analyze the true value of customers, identify bottlenecks in the funnel, and provide the business with a basis for product or scoring changes.
Objective: Combating fraud and assessing credit risk.
- DWH downloads transaction information, user actions in the application, and data from the CRM in near real-time (e.g., every 15 minutes).
- A user_risk_profile showcase is created, which aggregates client behavior: frequency and amount of transactions, device geolocation, and request history.
- Using this clean and connected data, a Data Scientist trains an ML model that assigns a risk score to each new transaction.
When a user attempts a suspicious transfer, the system verifies not only the transaction itself but also its entire profile from the vault in milliseconds. If the risk is high, the transaction is blocked for additional verification. This protects clients’ funds and the bank’s reputation.
Marketing
Instead of disparate reports by channel, analysts now work with a unified dashboard: costs, conversions, and LTV are all linked. This allows them to go beyond simply counting clicks and understand which campaigns are truly driving results.
Objective: To evaluate the return on investment (ROMI) in advertising and optimize the marketing budget.
- DWH collects click and impression data from advertising systems, and conversion data (applications, purchases) from CRM and the website.
- Internally, we employ a complex but company-wide attribution logic. For example, we use last-click attribution before conversion.
- The marketing_campaign_performance showcase is built, where the expenses and total sales assigned to each campaign are indicated.
The Strategic Marketer: Maximizing ROI
A sophisticated marketer sees far beyond basic clicks and impressions; they track and optimize the entire customer journey. Operating with full data transparency, they can say with absolute certainty:
“Our Meta and TikTok paid social campaigns are driving users with the lowest Customer Acquisition Cost (CAC), whereas Google Paid Search targeting our branded keywords brings in the highest Lifetime Value (LTV) customers.”
With these insights, marketing budgets are dynamically reallocated away from underperforming campaigns and shifted into these highly effective channels. As a result, waste is eliminated, and the company’s Return on Marketing Investment (ROMI) scales significantly.
How DWH Works: Architecture and Data Layers
An analyst opens the data warehouse and works with the already prepared information, without thinking about how exactly it got there. To make this possible, the Data Warehouse is built as a separate system with its own rules. It has clearly defined workflow stages: sources → loading → cleaning → analytical tables. It’s a streamlined pipeline. Its essence lies not in storage, but in the sequential transformation of data from raw and disparate to ready for analysis. The process is anchored in a layered architecture, where each layer performs its own task.

Layered architecture: from raw data to data marts
Step 1. Ingestion
This is the entry point. Special processes (ETL/ELT pipelines) automatically extract data from business operating systems: application databases, CRM systems, payment gateways, log files, and external APIs. They operate on a schedule (batch) or in real time (streaming).
Step 2. Save as is (Raw / Staging Layer)
The first physical layer within the DWH. All acquired data is stored here unchanged. It’s like a digital photograph of the source’s state at the time of download.
Data in this layer:
- Can have any format;
- Often contain errors and duplicates.
This layer is rarely used by analysts: it’s needed for historical reconstruction, debugging, and download control. Data engineers typically work here.
Step 3. Tidied up (Core / Integration Layer)
The second and most important technological layer. This is where key transformations occur. Information from the raw layer:
- Cleaned: typos are corrected, duplicates are removed, and omissions are marked.
- Standardized: all dates are converted to a single format, and codes and names are unified
- Integrate: data from different sources is combined according to rules. Fundamental, reliable entities are created—records of customers, products, and transactions.
The result is shared references, correct relationships, and a history of changes. This is the foundation of the repository upon which all analytics rests.
Step 4. Prepared for analysis (Data Marts Layer)
Here, core data is transformed to meet specific business needs. Thematic data displays—structures optimized for reading—are created.
- Marketing Showcase: Data on advertising campaigns, leads, and conversions in a single table.
- Financial showcase: ready-made aggregates for revenue, expenses, and profit.
- Sales showcase: detailed data on receipts, products, and customers.
The data displays are denormalized, meaning the data is organized so that a minimal number of table joins are required to obtain an answer. The necessary facts are gathered in one place, making analysis fast and convenient.
This separation allows analysts to avoid worrying about the quality of downloads, and engineers to avoid worrying that their changes will break reports.
ETL/ELT
These aren’t just acronyms, but two different workflows that determine where and when key data transformations occur on their way to storage. This is a fundamental architectural decision.
Regardless of the approach, any pipeline includes three steps:
- Extract — obtaining information from source systems (databases, APIs, files).
- Transform (Transformation) – cleaning, standardizing, combining data, i.e., bringing it into order.
- Load – Places the resulting information into the target DWH table.
Important
The difference between ETL and ELT is in the sequence of steps T and L.
ETL (Extract → Transform → Load) is a classic approach.
Data is first collected from sources, then cleaned and combined outside the Data Warehouse, and only the finished result is loaded into the warehouse.
- Pros: good control and safety.
- Cons: difficult to scale, less flexible, raw data is often not saved.
ELT (Extract → Load → Transform) is the modern standard for cloud storage.
The data is first loaded into the DWH as is, and all transformations are performed internally using SQL.
- Pros: high scalability, flexibility, simpler architecture.
- Cons: Only useful when using modern cloud solutions; requires fine-tuning of permissions.
In teams where the boundaries between analytics and engineering are blurred, analysts can write SQL transformation scripts to create their own data marts, as all the necessary information is readily available. Knowing that there’s a raw data layer, if a specialist notices any oddities in the data, they can either query the engineer or verify the source data to find the root cause.
DWH Language: Data Models for Analytics
Within the system, information is organized according to specific logical patterns—models. These aren’t random; they address specific needs: maximizing the speed of analytical queries and making data intuitive for business users. There are two main models: “star” and “snowflake.” They are based on the concepts of facts and dimensions.
Fact Tables
Central tables containing events or operations to be analyzed. These are quantitative, measurable data, such as orders, views, payments, or subscriptions.
Facts contain numbers that can be summed and averaged. Each row represents a specific event, such as a single item on a receipt or a single ad click. Beyond these, the table primarily consists of keys (IDs) that link it to dimension tables.
Dimensions (Dimension Tables)
Reference tables that describe and provide context for facts. These are qualitative, descriptive data. For example, user, date, product, city, or device.
They contain text or numeric fields for filtering, grouping, and labeling. One row describes one object: one customer, one product, one day.
Important
A single fact table is linked to multiple dimension tables. This allows you to analyze measures (how much was sold) across attributes (what was sold, when, to whom, and where).
Star and Snowflake: Schemas for Quick Queries
Star diagram
The most common and optimal model for an analyst in the showcase layer.
At the center is a single fact table. Surrounding it are dimension tables, each of which is directly linked to the facts via a primary key.

Let’s take an example of an online store.
There is a fact table, sales_fact: sale_id, product_id (key), customer_id (key), date_id (key), store_id (key), quantity (measure), revenue (measure).
And measurement tables:
- dim_product (product_id, product_name, category, brand),
- dim_customer (customer_id, city, segment),
- dim_date (date_id, day, month, year, quarter, is_weekend),
- dim_store (store_id, store_name, region).
The analyst writes a query that starts with a selection from sales_fact, appends dim_product to it to filter by category, and dim_date to group by month. It’s quick and easy.
Why do they love the “star”:
- The structure is visually clear. It’s easy to understand which sections are available for analysis.
- For most queries, the DWH optimizer needs to make a minimum number of JOINs (usually one to each dimension table).
- Such systems (Tableau, Power BI) work effectively with the star schema.
Snowflake pattern
This is a more normalized option, where reference books are split into several related tables. It saves space and simplifies reference book maintenance, but makes queries slightly more complex. This design is typically chosen when scalability and a strict structure are important.
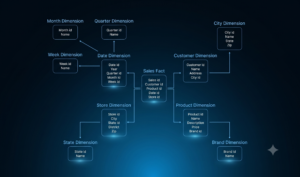
Dimension tables also have their own subdimensions. This means that the dimension attributes are separated into separate reference tables. The diagram visually resembles a snowflake, with not only rays but also branches radiating from the center.
Let’s take the same example with an online store, but use the snowflake diagram.
- The sales_fact fact table remains the same.
- The dim_product table now contains only product_id , product_name and **category_id** (key).
- A new table dim_category (category_id, category_name, **department_id**) appears .
- The table dim_department (department_id, department_name) appears .
On the one hand, the department name isn’t duplicated for each product, which saves space. On the other hand, to get the full product name and department, three joins are required instead of one. This slows down the analysis.
Principles of construction: subject orientation and historicity
Subject orientation
Data in a DWH is organized not around functions or applications, as in operating systems (OLTP), but around key business entities and processes of interest for analysis. The warehouse structure reflects business subject areas, not the structure of IT systems.
That is, if sales data is needed, the specialist does not go to the orders table from the store API or the payments table from the gateway, but to the ready-made sales showcase, where everything is already collected and connected.
Historicity of data
The system stores not only the current state but also changes over time. Data is not overwritten, but accumulated. This allows for analyzing dynamics, comparing periods, and identifying what changed and when.
For example, churn analysis can reconstruct the full interaction history of a departed customer and understand what led to their decision. Perhaps the user’s activity began to decline after three subscription price increases.
From Theory to Practice: How DWH is Built and Operates
Let’s follow the entire path from a business challenge to a completed insight. This is the routine work of a data warehouse analyst.
So, the business asks: “How are our sales changing month to month?”
Step 1: Translate the question into the language of metrics and cross-sections
- What is “sales”? Number of orders? Revenue (amount)? Profit (revenue minus expenses)?
- For what period? A calendar month? 30 days to the current date?
- What level of detail? By month? By week? By product category?
A specialist should clarify and formalize this. It’s good that the Data Warehouse already specifies that revenue is the sum of paid and delivered orders. There’s no need to clarify and re-approve.
Step 2: Selecting Facts and Dimensions
Where is the required data located?
- Fact table: orders_fact (order facts).
- Key dimension: dim_date (time dimension).
- The measure you need is final_revenue.
The analyst doesn’t have to worry about which system the order came from or how to link the client to the payment—these connections are already in place.
Step 3. Write an SQL query
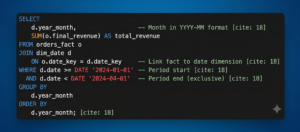
The system will execute queries in seconds, even over years of data, thanks to optimization for reading and aggregation.
Step 4. Data Sanity Check
Before showing the results to management, everything needs to be double-checked.
- Check the total amount against the previous period’s figure from the old report.
- Look for abnormal spikes or dips.
- Make sure that filters (for example, by order status) are applied correctly.
Thanks to the fact that DWH accumulates data, you can easily find information for the required year, month, or quarter.
Step 5. Build a dashboard and interpret the results
We load clean data from the warehouse into a BI tool (Power BI, Tableau). We create a chart or dashboard.
- The revenue trend by month becomes clear.
- Filters are added: by region, sales channel, and product category.
Step 6. Explore other hypotheses
The analysis rarely ends with the first question. Further clarifications follow:
- “Okay, overall revenue is growing. What if we break it down by new and existing clients?”
- “Which region has the highest growth?”
- “Growth through the number of orders or through the average check?”
You can scale your analysis instantly. To answer a new question, the analyst doesn’t need to start from scratch—simply add a new dimension ( dim_customer.segment ) or a new metric (order_count) to your query. The data for this is already there, cleaned, and ready.
Skills and tools
Working with storage is always a balance between technical skill and business intuition. Without the former, you won’t be able to retrieve the data. Without the latter, you won’t understand what to do with it and why.
Technical skills
- SQL
95% of work with DWH is writing SQL queries to extract and transform data from the data warehouses.
What is important to be able to do:
- SELECT , JOIN , WHERE , GROUP BY , ORDER BY — basic syntax.
- Window functions ( ROW_NUMBER() , RANK() , LAG() ) – for complex trend analysis and ranking.
- CTE (Common Table Expressions) and subqueries – for structuring complex queries.
- Query optimization – understand why a query is running slowly (lack of indexes, complex JOINs, large table scans).
The free “SQL Simulator” course will help you understand the basics of the query language and provide plenty of practical material to reinforce the theory.
- BI tools (visualization).
For example, Tableau, Power BI, and Google DataLens help transform query results into interactive charts and dashboards that are understandable to businesses.
It’s important to be able to create connected visualizations, configure filters, build data logic within the tool itself, and ensure dashboard performance.
In the free course “Data Visualization and Advanced Tableau,” you’ll learn how to design charts, create complex layouts, and use the program’s sophisticated functionality.
- Python /R Basics
This is optional, but highly recommended. It will allow you to tackle tasks that are difficult or impossible to solve with SQL, such as complex statistics, predictive modeling, and working with APIs to enrich data.
Understanding business
- The ability to ask the right questions and listen
Businesses often formulate symptoms (“sales are falling”) rather than the cause. The expert’s job is to get to the root of the problem by asking questions:
- Falling in comparison to what period?
- In all regions or in a specific one?
- Is the number of orders or the average bill falling?
- What event (release, advertising campaign, price change) preceded the change?
This is the context that will determine which tables in the DWH you will access and what JOINs you will make.
But it’s important not just to toss out a spreadsheet of numbers, but to tell a story in business terms. “Revenue increased by 10%” is a fact. “Revenue increased by 10% due to the existing audience, who began purchasing more frequently after the launch of the loyalty program, while customer acquisition costs remained unchanged” is an insight.
Conclusion
The Data Warehouse is the foundation of a company’s data-driven culture. It solves a key problem: transforming disparate operational data into a single, reliable, and historically complete source for analysis.
For an analyst, switching to DWH represents a qualitative shift in their profession. Instead of manually collecting and cleaning information, the majority of their time is now spent analyzing, identifying causes, and formulating hypotheses.
The implementation and proper use of such storage systems is not just an IT project, but an investment in the speed and quality of management decisions, which, in the long term, becomes a key competitive advantage.
Explore More IT Terms
#
A
- A Guide to SQL Query Formatting
- A/B testing
- Agile
- Algorithm
- Algorithm complexity in 5 minutes
- Algorithms and Data Structures in C#
- An overview of the C # programming language
- An overview of the Python programming language
- Anaconda Python
- Android
- Android App Bundle
- Android SDK
- Angular
- Ansible
- Apache
- Apache Airflow
- Apache Kafka
- Apache Tomcat
- App Store
- AppCode
- Applications of microcontrollers: From simple circuits in electronics to complex systems
- Applications of the derivative
- Arduino: How to Program It: Basics for Beginners
- Array-based stack
- ArrayList
- ASCII
- ASP.NET
- Assembly Language Lessons
B
C
D
- Data Analytics: applications of data analysis in companies
- Data Engineer - Who is it, what does a data engineer do, and an overview of the profession
- Data modeling: what it is, types, and process steps.
- Data preprocessing: a complete guide for beginners and professionals.
- Data structure
- Database Tests with Answers
- Deep Learning
- Defining Aliases
- Defining Arrays
- Deque
- Developing a Website from Scratch
- Differential Equations
- Differentiation of functions
- Digital data: understand the importance of this asset for businesses.
- Double integrals
- Doubly linked lists
E
F
H
- Handling errors and exceptions
- Heads or Tails? How Probability Theory Is Used in IT
- History of the development of computer science
- How to effectively organize your workflow
- How to Learn Java: Tips for Beginner Developers
- How to Learn PHP: A Beginner's Guide
- How to Use S3 Storage in Kubernetes with CSI
- HTML
- HTML and CSS: Definition, Application, and Operating Principles
- HTML and CSS. Layout from Scratch: What to Learn, Where to Learn, and How Long Will It Take?
- HTML Frame Structure
- HTML Link Formatting
I
- if..else construction
- Infinite sequences and series
- Information properties
- Inheritance in Java: A Complete Guide to Principles and Implementation
- Inserting an Image
- Integration of functions
- Interactive Python Tutorial – Learn Programming from Scratch
- Interview Problem: Finding a Deleted Element in O(N)
- Interview Scare: The FizzBuzz Challenge
- Introduction to C++
- Introduction to Machine Learning
- Introduction to programming languages
- IT Specialist Resume (CV)
J
K
M
- Machine Learning
- Machine Learning Basic Tool: NumPy
- Machine Learning Basic Tool: Pandas
- Machine Learning Mathematics
- Mathematics for programmers: what is really needed?
- Microcontroller and Microprocessor - what's the difference?
- ML Engineer: Who They Are, What They Do, How Much They Earn, and How to Become a Neural Network Specialist
- Monte Carlo Simulation: How It Works and What It's For
O
P
- PHP lessons
- Private DNS server and its configuration
- Programmer's Dictionary
- Programming with pseudocode
- Python Code Formatting Guide: PEP8
- Python for data analysis: how to do it and main libraries
- Python Lessons
- Python Superstar: 5 Ways to Use the * Operator
- Python vs. Julia: Should You Replace Python with Julia?
R
S
- SFML Graphics Library Tutorials
- Sorting Algorithms in Programming: Types, Descriptions, and Comparisons
- SQL commands: see what they are, what the main ones are + examples
- SQL Interview Questions and Tasks
- SQL Lessons
- SQL Stored Procedures
- SQL Syntactic Sugar: The COALESCE Function
- Stack
- Start in analytics: Python or R
- Statistical analysis: importance for decision making.
- String formatting in Python
- Structure of computer science
- Swift Lessons
- switch/match construct
T
- Terms in programming
- Text and paragraph formatting tags
- The concept of information and its transmission
- The Future of Python: Key Trends and Insights from Global Researc
- The pip package manager in Python
- The role of informatization in the development of society
- Transfers
- Tutorials / Articles
- TypeScript: What It Is and Why Developers Need It
W
- What are databases, and why do they need DBMS and SQL?
- What do Linux distributions consist of?
- What is .NET and what is it used for?
- What is a GPU in a computer, in simple terms?
- What is Arduino: How it Works and the Platform's Capabilities
- What is Big Data? Introduction, Types, Characteristics, and Examples
- What is Golang and what is it used for?
- What is Haskell and what is it used for?
- What is Kotlin and what is it used for?
- What is Linux? The History of Linux
- What is machine learning, and how does it work?
- What is Power BI: everything about the data analytics software
- What is the C++ programming language?
- What is the OSI Model: A Complete Explanation of the Seven Layers and Their Role in Networking
- What's the difference between x86 and ARM processors?
- Where to start learning the C programming language?
- Which Linux distribution should you choose? A Linux distribution overview