
Big Data: What is it in simple terms, characteristics, and technologies
- What is Big Data technology?
- Key Features of Big Data (6V)
- What types of big data are there?
- What is the difference between big data and databases?
- How to work with big data: from collection to analysis
- Big Data Technologies and Tools
- Big data analysis methods
- Where is big data used?
- Read also:
- Who works with Big Data?
- Pros and cons of Big Data
- How to Get Started with Big Data: Tips for Beginners
- Conclusion
Have you ever noticed how, after a conversation about home improvement, ads for tile and paint pop up on your phone? This is no coincidence. Every day, humanity creates a massive amount of data—approximately 328-400 million terabytes.
To put this into perspective, consider that every person on Earth uploads dozens of photos to social media every second. Standard programs like Excel aren’t designed to handle such volumes and quickly become overloaded.
This is where Big Data technology came into being. In this article, we’ll explain what it is, how it works, its characteristics, and the specialists working in this field.
What is Big Data technology?
So, you’ve decided to renovate. You started by googling small kitchen designs. Then you visited a couple of tile websites. And then, in an evening conversation with a friend, you mentioned that you should probably install laminate flooring.
What happens next? An hour later, you receive a notification: “20% off laminate flooring.” Your social media feed is filled with videos showing how to choose a wall color. And your phone’s GPS suddenly shows the fastest route to the hardware store. Coincidence? I don’t think so.
The system brought together:
- your search queries;
- geolocation (I realized that you are near a hypermarket);
- anonymized data of thousands of other people who did renovations and then bought laminate flooring of this particular brand;
- How many seconds did you spend looking at kitchen photos on the internet?
Simply put, big data is vast amounts of information, too large or complex for traditional processing methods. It can include text, images, videos, or user activity records. It can be used to identify patterns, make predictions, and make more accurate decisions.
The term first appeared in 1998. John Mashie, chief scientist at Silicon Graphics, mentioned it in a presentation predicting the growth of data volumes. At the time, it was only relevant to a small circle of specialists.
A real surge of interest began in 2008, when Clifford Lynch, editor of the scientific journal Nature, prepared a special issue on the impact of massive data technologies on the future of science. This issue is considered the official birth of the term as we understand it today. Lynch spoke about the rapid growth of information and the need for new approaches to its analysis.
Initially, big data processing was of interest not to entrepreneurs but to scientists. In 2010–2011, the concept actively penetrated business, and innovative companies began to integrate these technologies into their strategies.
Key Features of Big Data (6V)
The properties of Big Data can be described through several characteristics, the combination of which is traditionally called “6V”.
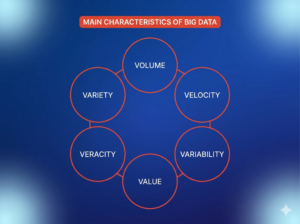
- Volume ranges from hundreds of gigabytes to petabytes and even zettabytes. The scale grows every year. It comes from a wide variety of sources: social media, sensors, purchases, etc.
- Velocity – information arrives very quickly, sometimes in real time. For example, a post appears on social media or a person makes a purchase online – all of this requires instant processing to make important decisions.
- Variety —social media profiles, images, logs, texts, videos. All of this needs to be collected and analyzed somehow.
- Veracity – the quality of incoming data varies. Sometimes it’s incomplete or erroneous, so it’s important to be able to filter out unreliable sources to ensure accurate analysis. This is especially true in areas such as finance or healthcare.
- Variability – flows can be unstable, changing depending on various factors, such as season or user behavior. This complicates analysis but also opens up new opportunities when using flexible methods.
- Value – large data sets themselves are not as important as the conclusions that can be drawn from them. This is the primary goal of working with Big Data: to find useful insights and apply them to business or science.
What types of big data are there?
A common misconception is that large data always means huge tables of numbers. In reality, things are much more varied. Let’s look at the three main types of data.
Structured
Those that are already stored in neat tables. Each column contains a specific type of information: “date,” “amount,” “client ID,” and “city.”
- Your bank card statement: date, amount, store, transaction status.
- Timesheet: employee, hours, date, project.
- Cash receipt in a store: product, price, quantity, total.
Semi-structured
They don’t have strict tables, but they do have labels and tags that help computers understand the structure. For example, the JSON format is what applications and websites exchange.
Imagine a business card. It has no columns or rows, but it does have fields for a name, phone number, and address. The computer sees these tags and knows where to look. Other examples:
- Web pages. HTML tags tell the browser: “this is a title,” “this is a link,” “this is an image.”
- Emails. Each email has service fields: from, to, date, subject, and then the text inside.
- Server logs. Each line looks like this: [2025-01-15 14:23:01] User 12345 ordered item 987 — there’s a date, ID, and action, but it’s not a table.
Unstructured
Anything that doesn’t fit into tables or tags. This is the most common type of data—around 60-80% of all information in the world. It’s because of this that Big Data was invented, because traditional software can’t handle it.
| Data type | Example | Where it is found |
| Text | Social media posts, reviews on marketplaces, comments on video hosting sites | Opinion analysis |
| Images | Photos of products, medical images (MRI, CT), satellite images | Cancer diagnostics by imaging, facial recognition |
| Video | CCTV footage, training videos, live broadcasts | Metro safety, in-store customer movement analysis |
| Audio | Call center calls, voice messages, podcasts | The robot evaluates whether the client is angry or happy |
| Geodata | Phone tracker, car GPS, social media tags | The navigator plots a route around traffic jams |
Here’s how the three types of data work together when you’re simply buying bread.
- Structured: Receipt: “bread – 50 rubles, 01/15/2026, 19:32”.
- Semi-structured: Cash register log: [19:32:01] Item 234567 added. [19:32:05] Payment by card ***1234 .
- Unstructured:
- Camera video of you walking to the bread shelf. Here, analysts can see how long it took you to choose.
- Geodata from your phone: you entered the store 5 minutes after driving past the bakery.
- Product review in the store app: “The best bread in town.”
What is the difference between big data and databases?
Differences in size, architecture, processing methods, and purposes of use.
Volume and types of stored information
Conventional databases typically handle volumes ranging from a few megabytes to a gigabyte, and in rare cases, up to several terabytes. One terabyte is equivalent to approximately 200,000 photos from a 12-megapixel camera. Most such systems store structured data. For example, a shopping center management company stores a list of tenants, contract numbers, and monthly rent amounts in a typical database.
Truly large volumes of information range from tens to hundreds of terabytes, to petabytes (1 petabyte = 1024 terabytes). A significant portion of this data is unstructured or semi-structured: video files, audio recordings, text messages, server logs, and sensor readings. In the example above, the management company also accumulates Big Data: video recordings from surveillance cameras on all floors, as well as logs of escalators and ventilation systems.
The rate of new data receipt
In conventional databases, information is added relatively infrequently and in a controlled manner: an order is placed, a new customer is registered, an invoice is issued. Minutes or hours may pass between entries.
Big Data is characterized by a continuous, high-speed flow. Thousands of devices simultaneously transmit data, and events are recorded millisecond by millisecond. Large systems can process millions of events per second.
Storage and processing architecture
A typical database is most often hosted on a single server or several servers operating as a single cluster. All requests are processed centrally.
Working with large volumes of data requires distributed storage and processing across hundreds of independent servers. We’ll discuss this process in more detail below.
How to work with big data: from collection to analysis
This is a sequential process that includes several stages. In real-world projects, these stages are often performed cyclically rather than strictly sequentially. For example, during analysis, it may become clear that the collected information is insufficient or of poor quality, so it’s necessary to return to the collection or cleaning stage.
Collection
Information comes from various sources:
- websites;
- social networks;
- Internet of Things (IoT) sensors and devices;
- mobile applications.
Imagine visiting a website, and every action you take—page navigation, button clicks, form submissions—is recorded in real time. These actions aren’t recorded manually, but are automatically tracked by specialized software. For example, when you leave a comment on a social network, the system immediately records your comment, the time it was posted, and any interactions with other posts.
Storage
To preserve all this, two main approaches are used.

Physical storage consists of servers located in data centers. Companies purchase and maintain expensive, powerful computers, which give them complete control over their data. However, this requires significant investment and effort.
Cloud storage is renting space on remote servers managed by large companies like Google or Amazon. The advantages of the cloud include flexibility, scalability, and savings on infrastructure. For example, companies can increase storage capacity when they need to process more information during peak periods.
Many companies use data lakes, which are hosted in cloud services such as Amazon S3, Google Cloud Storage, or Microsoft Azure. These data lakes accommodate all types of data—both structured (tables) and unstructured (text, images, videos). Because it’s all contained in one place, there’s no need to immediately organize it. For example, an online store’s data lake might contain logs, reviews, product photos, and so on.
Processing and cleaning
The purpose of these stages is to transform the raw material into a structured and verified format suitable for analysis.
The main methods of big data processing are divided into two types.
- Batch processing —data is accumulated over a period (hour, day) and processed as a single array. Example: daily inventory recalculation in an online store.
- Stream processing – data is analyzed in real time as it arrives. Example: checking bank transactions for fraud in a fraction of a second.
Cleaning involves removing duplicates, filling gaps, filtering out abnormal values, and standardizing formats.
Analysis and visualization
Big data analysis is the process of searching refined data for patterns, connections, and anomalies that are impossible to detect with the naked eye. Programs sift through vast amounts of data, searching for repeating patterns. For example, they might notice that customers are more likely to buy umbrellas after checking the weather forecast. Or they might note that doctors at the hospital prescribe a specific medication, which is more likely to result in improvement.
To avoid getting bogged down in tables and numbers, analytics results are visualized in graphs, charts, and heat maps. This makes it easier to understand. A manager might see, “Aha, sales are falling here,” or “That’s why there are delays in the warehouse.”
Big Data Technologies and Tools
Working with big data requires specialized tools that can store petabytes of information, distribute computations across thousands of servers, and process data in real time.
Frameworks for processing
This is a set of software components that provide ready-made solutions for common tasks. In the context of Big Data, frameworks manage distributed storage and computing, eliminating the need for developers to write low-level code to work with a server cluster.
Apache Hadoop is a system that helps process terabytes of content. It distributes information across multiple servers, accelerating processing. For example, a research center processes five years of telescope logs. The data volume is 3 petabytes (3 million gigabytes). Hadoop breaks this data into 128-megabyte chunks and distributes them across 500 servers. A task to search for specific types of cosmic signals is performed in parallel across all servers simultaneously, reducing processing time from months to hours.
Apache Spark is a more modern platform that performs faster than Hadoop by storing intermediate data in RAM rather than on disk. Spark supports not only batch processing but also streaming and includes libraries for machine learning and working with relational graphs.
Example: A streaming audio service processes the behavior of 50 million active listeners. Spark Streaming analyzes listening behavior in real time: if a user skips a track within the first 10 seconds, the system instantly suggests the next track in a different genre. Simultaneously, the Spark MLlib machine learning library retrains the recommendation model based on data accumulated over the past hour.
Databases
SQL (relational) databases are systems that store data in tables with strict relationships between them. They require a predefined table structure and support precise queries in the SQL language. Examples: PostgreSQL, Oracle, Microsoft SQL Server.
In Big Data, this type of database is used to store structured business data where accuracy and integrity are crucial. For example, in a financial report, each transaction must be recorded exactly once, and debit and credit amounts must match.
NoSQL databases (from “Not Only SQL”) are a broad class of systems that don’t require a fixed table schema and can store semi-structured or unstructured data. They offer high write speeds and horizontal scalability, meaning new servers can be added without system downtime. Such a database doesn’t require all users to have the same set of fields. A new record won’t change the entire structure.
Programming languages
Python is the most versatile and popular language in the Big Data field. It combines ease of learning with a vast ecosystem of libraries for data analysis, machine learning, and working with distributed systems.
Python’s key libraries:
- Pandas — working with tabular data.
- NumPy — mathematical calculations with arrays.
- Scikit-learn — classic machine learning algorithms.
- TensorFlow / PyTorch – deep learning (neural networks).
- PySpark – Interact with Apache Spark from Python.
R is a language designed specifically for statistical analysis and data visualization. It contains hundreds of built-in statistical tests and functions, as well as the ggplot2 library for creating complex graphs. In scientific research, statistics, economics, and anywhere that requires deep statistical hypothesis testing and high-quality visualization.
Scala is a language that runs on the Java Virtual Machine (JVM). Apache Spark is written in Scala, so using it allows for maximum performance when working with the platform.
Big data analysis methods
The three methods described below do not replace but rather complement each other. The first helps formulate hypotheses, the second builds a model, and the third applies that model to decision-making.
Data Mining
The name reflects the essence: just as a miner extracts nuggets of gold from tons of rock, an analyst extracts meaningful patterns from chaotic data. Data mining lies at the intersection of statistics, mathematics, and information technology. Unlike simply calculating sums or averages, this method reveals relationships the analyst might not even suspect.
The main tasks solved with its help:
- Clustering is the division of objects into groups based on similar characteristics without pre-defined criteria.
- Search for association rules – detection of “if A, then with high probability B” connections.
- Anomaly detection is the search for rare events or objects that differ significantly from others.
- Regression analysis is the search for relationships between variables and the prediction of numerical values.
Machine learning
This is a subset of artificial intelligence in which computer systems are trained using historical data and draw conclusions or predictions without explicitly programming rules. Instead of writing code such as “if the temperature is above 25°C, then recommend ice cream,” a specialist feeds the model thousands of sales examples across different days, and the model automatically detects correlations based on temperature, day of the week, season, and other factors.
Predictive analytics
This is a combination of methods, including data mining, machine learning, and statistical modeling, used to forecast future events based on historical data. The results of predictive analytics are always probabilistic: the system doesn’t output “this will happen,” but rather “this will happen with X% probability.”
This type of analysis does not provide absolutely accurate predictions, but it allows for more informed decisions than intuition or simple extrapolations like “last year’s sales grew by 5%, which means they will grow this year too.”
Where is big data used?
Technology is permeating many sectors of the economy and society. The synergistic effect of Big Data and artificial intelligence is particularly noticeable: AI helps identify complex patterns in vast amounts of information, while Big Data provides the raw material for training algorithms. With their help, companies and organizations reduce costs, increase revenue, prevent risks, and improve service quality.
Retail and marketing
Have you ever noticed how marketplaces suggest the perfect product at the perfect moment? This isn’t a coincidence. Their systems analyze what you’ve watched, purchased, and added to your cart. This allows them to show you offers that are truly useful. Streaming services do the same: Netflix and Kinopoisk recommend movies based on your interests.
Banks and finance
Banks and payment systems monitor transactions to prevent fraud. For example, if someone unexpectedly attempts to withdraw money from your card in another country, the system can automatically block the transaction and alert you.
Medicine
Hospitals use Big Data to make diagnoses faster, predict complications, and even create customized treatment plans. For example, if hundreds of patients with similar symptoms have had the same condition, the system can prompt doctors to identify specific areas to focus on.
Who works with Big Data?
This industry involves a variety of specialists, each of whom solves their own problem.
Data Engineer
Creates and maintains systems for collecting, storing, and processing information.
Main responsibilities:
- The creation of automated processes that retrieve data from sources (website logs, databases, third-party APIs), transform it into the required format, and load it into a data warehouse. This approach is often referred to as ETL (Extract, Transform, Load).
- Setting up storage systems – deployment and support of databases, distributed file systems, and object storage.
- Raw material quality assurance – implementing checks that detect omissions, duplicates, or abnormal values at the data entry stage.
- Performance monitoring – tracking the speed of information processing, server load, and timely system scaling (adding new servers).
- Ensuring security and access control – setting up access rights to data in accordance with company policies and legal requirements.
The demand for these specialists is constantly growing. If you want to master this promising profession through practical tasks and under the guidance of industry experts, take the “Data Engineer from Scratch” course. The program also includes career support and personalized resume recommendations from active HR experts.
Data Analyst
Works with already collected and cleaned data to answer specific business questions. It transforms raw numbers into understandable reports, graphs, and dashboards (interactive panels with key metrics).
An analyst answers the question “what happened and why?” but does not make predictions (that’s the job of a data scientist) or create infrastructure (that’s the job of an engineer).
Data Scientist
They analyze not only the past but also build models to predict the future and create algorithms that can make automated decisions. For example, at a bank, they can predict which clients will take out a loan and repay it on time.
Pros and cons of Big Data
| Pros | Cons |
| The findings are based on an analysis of real data on customer behavior, sales, and operational processes. | Storing petabytes and processing them on clusters of hundreds of servers requires significant investments in hardware, software, and cloud resources. |
| Identifying hidden patterns that cannot be seen through manual analysis. | Shortage of qualified personnel. |
| Anticipate future events such as customer churn, demand fluctuations, credit risks, or disease outbreaks, allowing you to take proactive measures. | The collection and storage of large volumes of personal data create risks of data breaches and require strict compliance with the law. |
| Each customer can be offered personalized products, content, or services, which increases loyalty and average order value. | If the data entering the system is of poor quality, any conclusions and forecasts will be unreliable, regardless of the complexity of the algorithms used. |
| Companies that effectively use big data can respond more quickly to market changes, more accurately predict trends, and offer customers what their competitors don’t yet offer. | In some industries and jurisdictions, legislation has not kept pace with technological advances, creating risks when using certain data collection and analysis methods. |
How to Get Started with Big Data: Tips for Beginners
- Master SQL, the foundational language for working with databases (2–4 weeks). You can learn the basics for free on our simulator.
- Learn Python and Pandas, the core language and library for data analysis (1–2 months).
- Learn the basics of statistics – averages, correlations, distributions (2–3 months).
- Complete 2-3 practical projects, such as sales analysis or customer segmentation.
- Use open data – Kaggle, UCI Machine Learning Repository.
You can also enroll in a specialized course. This will provide a theoretical foundation and practical skills. You can gain a strong scientific background and a state-recognized diploma in our joint Master’s program “Big Data Analytics” with HSE. The course offers all the benefits of full-time study, but is offered online.
Conclusion
We’ve defined “big data,” outlined the key characteristics of big data, and described the methods used to process large databases. Today, this technology is actively used in various fields, from business to science. As with any innovation, it faces its challenges, such as a shortage of specialists and high implementation costs. However, the prospects are also enormous. It’s expected that this approach will soon be adopted by almost all companies, and the market will continue to grow.
Explore More IT Terms
#
A
- A Guide to SQL Query Formatting
- A/B testing
- Agile
- Algorithm
- Algorithm complexity in 5 minutes
- Algorithms and Data Structures in C#
- An overview of the C # programming language
- An overview of the Python programming language
- Anaconda Python
- Android
- Android App Bundle
- Android SDK
- Angular
- Ansible
- Apache
- Apache Airflow
- Apache Kafka
- Apache Tomcat
- App Store
- AppCode
- Applications of microcontrollers: From simple circuits in electronics to complex systems
- Applications of the derivative
- Arduino: How to Program It: Basics for Beginners
- Array-based stack
- ArrayList
- ASCII
- ASP.NET
- Assembly Language Lessons
B
C
D
- Data Analytics: applications of data analysis in companies
- Data Engineer - Who is it, what does a data engineer do, and an overview of the profession
- Data modeling: what it is, types, and process steps.
- Data preprocessing: a complete guide for beginners and professionals.
- Data structure
- Database Tests with Answers
- Deep Learning
- Defining Aliases
- Defining Arrays
- Deque
- Developing a Website from Scratch
- Differential Equations
- Differentiation of functions
- Digital data: understand the importance of this asset for businesses.
- Double integrals
- Doubly linked lists
E
F
H
- Handling errors and exceptions
- Heads or Tails? How Probability Theory Is Used in IT
- History of the development of computer science
- How to effectively organize your workflow
- How to Learn Java: Tips for Beginner Developers
- How to Learn PHP: A Beginner's Guide
- How to Use S3 Storage in Kubernetes with CSI
- HTML
- HTML and CSS: Definition, Application, and Operating Principles
- HTML and CSS. Layout from Scratch: What to Learn, Where to Learn, and How Long Will It Take?
- HTML Frame Structure
- HTML Link Formatting
I
- if..else construction
- Infinite sequences and series
- Information properties
- Inheritance in Java: A Complete Guide to Principles and Implementation
- Inserting an Image
- Integration of functions
- Interactive Python Tutorial – Learn Programming from Scratch
- Interview Problem: Finding a Deleted Element in O(N)
- Interview Scare: The FizzBuzz Challenge
- Introduction to C++
- Introduction to Machine Learning
- Introduction to programming languages
- IT Specialist Resume (CV)
J
K
M
- Machine Learning
- Machine Learning Basic Tool: NumPy
- Machine Learning Basic Tool: Pandas
- Machine Learning Mathematics
- Mathematics for programmers: what is really needed?
- Microcontroller and Microprocessor - what's the difference?
- ML Engineer: Who They Are, What They Do, How Much They Earn, and How to Become a Neural Network Specialist
- Monte Carlo Simulation: How It Works and What It's For
O
P
- PHP lessons
- Private DNS server and its configuration
- Programmer's Dictionary
- Programming with pseudocode
- Python Code Formatting Guide: PEP8
- Python for data analysis: how to do it and main libraries
- Python Lessons
- Python Superstar: 5 Ways to Use the * Operator
- Python vs. Julia: Should You Replace Python with Julia?
R
S
- SFML Graphics Library Tutorials
- Sorting Algorithms in Programming: Types, Descriptions, and Comparisons
- SQL commands: see what they are, what the main ones are + examples
- SQL Interview Questions and Tasks
- SQL Lessons
- SQL Stored Procedures
- SQL Syntactic Sugar: The COALESCE Function
- Stack
- Start in analytics: Python or R
- Statistical analysis: importance for decision making.
- String formatting in Python
- Structure of computer science
- Swift Lessons
- switch/match construct
T
- Terms in programming
- Text and paragraph formatting tags
- The concept of information and its transmission
- The Future of Python: Key Trends and Insights from Global Researc
- The pip package manager in Python
- The role of informatization in the development of society
- Transfers
- Tutorials / Articles
- TypeScript: What It Is and Why Developers Need It
W
- What are databases, and why do they need DBMS and SQL?
- What do Linux distributions consist of?
- What is .NET and what is it used for?
- What is a GPU in a computer, in simple terms?
- What is Arduino: How it Works and the Platform's Capabilities
- What is Big Data? Introduction, Types, Characteristics, and Examples
- What is Golang and what is it used for?
- What is Haskell and what is it used for?
- What is Kotlin and what is it used for?
- What is Linux? The History of Linux
- What is machine learning, and how does it work?
- What is Power BI: everything about the data analytics software
- What is the C++ programming language?
- What is the OSI Model: A Complete Explanation of the Seven Layers and Their Role in Networking
- What's the difference between x86 and ARM processors?
- Where to start learning the C programming language?
- Which Linux distribution should you choose? A Linux distribution overview