In businesses that make informed decisions, there are many ways to extract insights from data, one of which is using Python for data analysis.
Data analysis with Python has become very popular among data scientists and analysts because it offers resources, vast libraries, and good functionalities to data professionals who use this programming language.
In this article, understand what data analysis with Python is, why to use this programming language for data analysis, the main Python libraries, and more!
What is data analysis with Python?
Python is a programming language that has become very popular in the community of analysts and data scientists.
Making decisions based on real business data has guided the practice of many companies seeking to be more assertive and strategic.
To achieve this, data collection, processing, analysis, and visualization must be optimized and focused on extracting the maximum amount of valuable insights for the business, while also being efficient.
Thus, the Python programming language has been the primary choice for data science professionals. This language boasts a vast ecosystem of libraries, which are ideal for supporting data manipulation and analysis.
In addition, it provides other resources that support this process, such as data visualization through easy-to-understand graphs or support for machine learning and deep learning through libraries specifically designed for this purpose.
Therefore, Python is a very suitable programming language for performing data analysis processes simply and intuitively, while also having complete libraries that optimize this process.
Why use Python for data analysis?
There are many advantages to using Python for data analysis. Check out some of them below!
Diversity of libraries available
One of the main advantages of using Python to analyze and visualize data is the availability of dedicated libraries for this purpose in this programming language.
Libraries offer tools for manipulating, organizing, and transforming data, creating visual graphs, and other essential resources for accurate data analysis.
Some libraries used in data analysis with Python are:
Established community of professionals
Another major benefit is the large and well-established community of professionals who use Python for data analysis.
As mentioned, Python has become very popular among data analysts and related fields. This makes the community of professionals who use this programming language very strong.
Thus, data professionals, whether beginners or experienced, can count on the support of the community, as well as have meaningful exchanges to improve both their work and contribute to the community.
Another advantage is that, in addition to support, professionals also receive frequent updates to the Python libraries, optimizing their work with this type of programming language.
It can be used for other purposes.
In addition to its use for data analysis, the Python programming language also serves other programming purposes. Therefore, it is a versatile and multifunctional language that can be widely used to execute various types of projects.
For example, Python can be used for web development, with libraries like Flask and Django, as well as for task and process automation, software and game development, among other things.
Easy to learn
Many people consider Python to be an easier programming language to learn and implement. This is due to several reasons, such as:
- It has a clear and easy-to-understand syntax, being more readable and direct, unlike other programming languages such as C++.
- It uses “indentation,” a hierarchical organization of elements that makes the language more organized and clean, and therefore easier to learn and execute. While in other languages the use of symbols such as braces and parentheses is common to delimit the code, in Python, indentation makes this process more organized from the beginning.
- It is open source, which means it operates on open code and offers many materials, documentation, resources, and libraries for beginners.
- It has an engaged community willing to help entry-level professionals, making the process more immersive and optimized.
Key libraries for data analysis with Python
One of the factors that makes the Python programming language excellent for data analysis is its well-structured, extensive, constantly updated, and high-level libraries.
The main libraries for performing data analysis with Python are:
Pandas
One of the best-known and most widely used libraries by data professionals, it allows users to manipulate, transform, and analyze data in a highly optimized way.
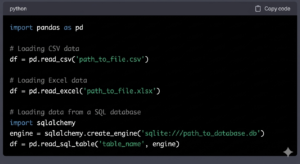
Pandas allows reading data in various formats, such as SQL, CSV, Excel, etc., and primarily works with two types of data structures: Series and DataFrames.
DataFrames follow a structure similar to an Excel spreadsheet, while Series refers to a one-dimensional array, which can be understood as a simple list of values. Other elements of Pandas include handling null data and merge and join operations.
NumPy
The NumPy library compiles functions related to linear algebra and numerical computation, working with multidimensional arrays, fast calculations, and other functionalities.
Furthermore, the NumPy library is at the core of basically all programs and libraries that handle mathematical operations and use the Python programming language.
For example, the Pandas library itself bases its data structure ( DataFrames and Series ) on NumPy arrays.
Matplotlib
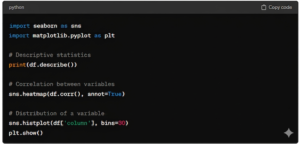
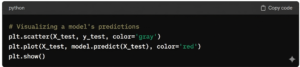
Matplotlib is a library geared towards data visualization, enabling the creation of 2D, 3D, line, bar, scatter, histogram, and other types of graphs.
In it, data visualization can be customized according to the professional’s needs, ensuring great flexibility for creating charts for data analysis.
Seaborn
The Seaborn library works on top of the Matplotlib library, meaning it can also be used for data visualization. The difference lies in the ability to create more visually appealing graphs, making data analysis more intuitive.
Essential functions for performing data analysis with Python.
There are several functions and commands in Python that are used to perform data analysis with this programming language.
These functions are related to the libraries used in this process and serve to import, read, manipulate, transform, and visualize the data. The most widely used library, Pandas, performs a large part of the data analysis process and has crucial functions for this process.
The first step in starting data analysis is to import a Python library into the project’s existing code to add functionality and other elements.
To do this, you use the command: import. For example, if you are going to work with the Pandas library, you use the function import pandas as pd to load this library into the code being used.
Next, the main commands for performing data analysis with Python using Pandas are:
read_*()
To begin a data analysis project, it is necessary to load the data into the DataFrame. Therefore, the read_*() function will import data from a file in the chosen format so that it can be analyzed in the project.
Some of the most commonly used formats are:
- read_csv
- read_excel;
- read_sql;
- read_html;
- read_json, etc.
head()
The head() command displays the first few rows of the loaded database to help you better visualize the data present in this dataset.
Normally, if the data analyst does not enter any values, this function displays the first five rows of the database.
describe()
Once you’ve imported data for analysis and gained an overview of that information, using the describe() function will provide descriptions of important numerical variables in the loaded data, such as average values, standard deviation, and others.
DataFrame.dtypes
DataFrame.dtypes is an attribute used to identify the data types in each column of the dataset, interpreting how Python reads this data in its library.
This attribute is frequently used in data processing to clean or transform data before proceeding with the analysis.
drop()
The drop() function helps remove irrelevant rows or columns from a data table. This command helps filter out what is important for a more in-depth data analysis.
fillna()
The fillna() function is used to fill in missing values in a Python dataset.
This process is fundamental in data processing, since if they appear in an analysis as null values due to input errors or any other reason, they can hinder the correct analysis of the data.
groupby()
In the data analysis process, you may establish criteria and, at times, you will need to group tables and data to perform an analysis.
The groupby() function is used to group the elements of a dataset, which is typically used to aggregate values from the dataset.
How to perform data analysis with Python
1. Data Import
The first step in data analysis is importing the data into the analysis environment. Python supports reading a wide range of data formats, including CSV, Excel, JSON, and SQL databases. Libraries like Pandas facilitate the import and manipulation of tabular data.